Mass Spectrometry of 3-Pyridylcarbinol Esters
Oxo (Keto) Fatty Acids
 As with
my other documents on mass spectrometry with electron-impact ionization, this is a subjective account that details only those fatty acids
relevant to this topic that were encountered during my research activities and for which we have spectra available for illustration purposes.
Spectra of 3‑pyridylcarbinol ('picolinyl') esters are described here, but I will only describe key diagnostic ions,
as general features of each type of derivative are described in other web pages on this site such as that dealing with
saturated derivatives.
Mass spectra of methyl esters of these fatty acids are described in a separate document.
I have no spectra for DMOX or pyrrolidine derivatives, as I was not using these in my work at the time these spectra were obtained,
but data have been published for the complete series of oxo octadecanoate isomers as pyrrolidides
(Tulloch, 1980).
Only a few of the spectra illustrated below have been published elsewhere, and all were obtained during studies of minor fatty acid constituents of milk and cheese with my collaborator at that time, Elizabeth Brechany (in the picture) (Brechany, E.Y. and Christie, W.W., 1992 and 1994). Prior to analysis by GC-MS, saturated and monoenoic fractions were obtained by silver ion HPLC. In total, we identified 51 different oxo fatty acids of which half were new to science. There seemed to be no obvious pattern to their occurrence, and their biosynthetic origin is not known.
Saturated Oxo Fatty Acids
As with 3-pyridylcarbinol esters in general, interpretation is straight forward if we start with the molecular ion and count back for loss of successive methylene groups. When an oxo group is reached, there is a gap of 28 amu for the loss of the C=O unit (alpha cleavage), followed by loss of successive methylene groups once more. The ions formed by cleavage beta to the oxo group tend to be especially abundant, and that of higher mass is frequently odd-numbered, presumably because it is protonated. Unlike spectra from methyl esters, only ions containing the carboxyl end of the molecule need be considered for interpretation purposes (see the web page on 3‑pyridylcarbinol esters of saturated fatty acids).
Mass spectrum of 3-pyridylcarbinyl 5-oxo-octadecanoate -
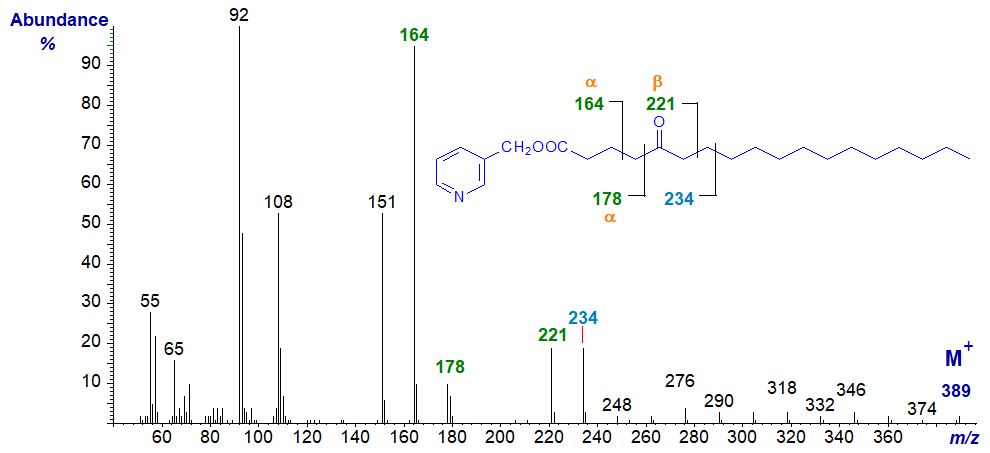
As is often seen with 3-pyridylcarbinol esters when a functional group is close to the carboxyl moiety, the cleavage pattern is not always as expected. In this instance, the gap of 28 amu for alpha (α) cleavage on either side of the oxo group between m/z = 178 and 206, is not immediately evident, although the beta (β) cleavage ions at m/z = 164 and 221 are distinctive. It is noteworthy that the last of these ions is odd-numbered. This may be useful in that gaps of 28 amu are also seen in the spectra of methyl-branched esters. Although this is a potential cause of confusion, the general look or 'fingerprint' of spectra of 3-pyridylcarbinol esters of methyl branched and oxo acids are very different, as will be seen for the remaining isomers illustrated here. In particular, the ions for alpha and beta cleavage tend to be much greater relative to the remaining ions in the spectra of saturated and monoenoic oxo acids.
Mass spectrum of 3-pyridylcarbinyl 7-oxo-octadecanoate -
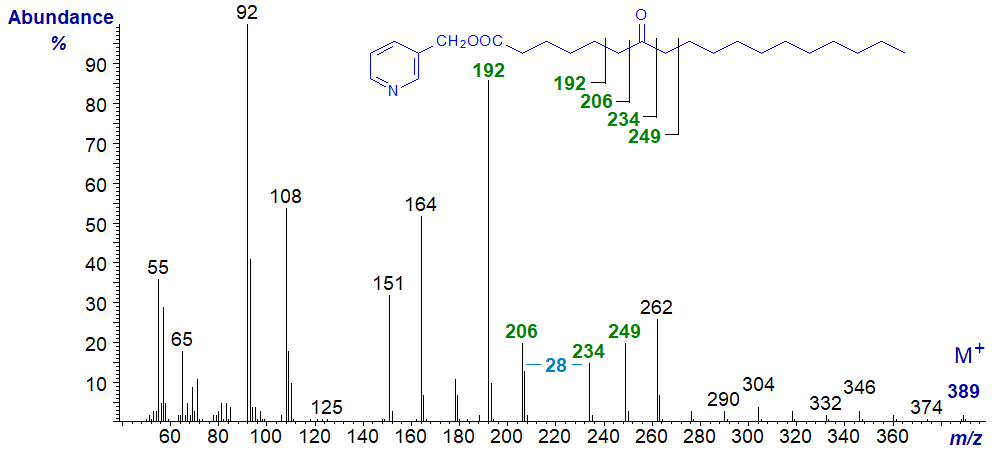
Now the gap of 28 amu between m/z = 206 and 234 for the C=O group is clearly seen, as are the beta cleavage ions at m/z = 192 and 249 (the latter is again odd numbered).
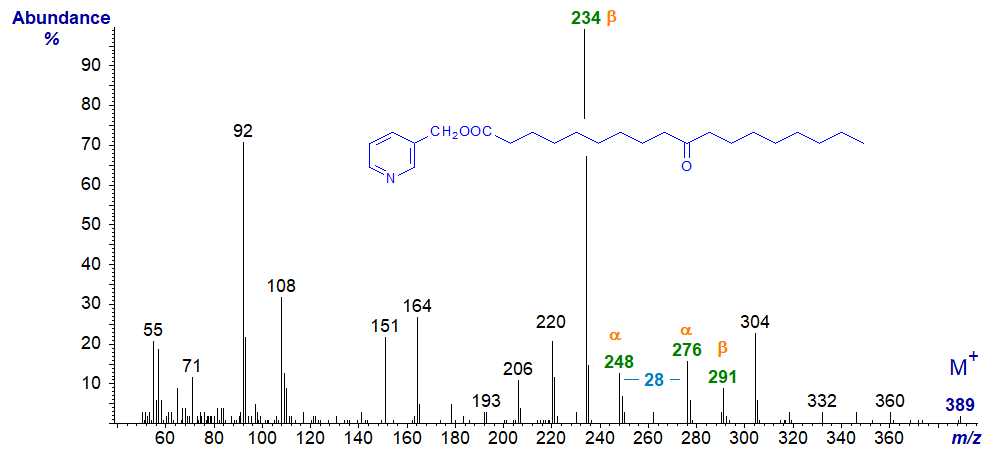
In the mass spectrum of 3-pyridylcarbinyl 10-oxo-octadecanoate, the gap of 28 amu for alpha cleavage is between m/z = 248 and 276, while those for beta cleavage ions are at m/z = 234 and 291.
In the mass spectrum of 3-pyridylcarbinyl 12-oxo-octadecanoate, the key ions are shifted up from the previous by 28 amu as expected -
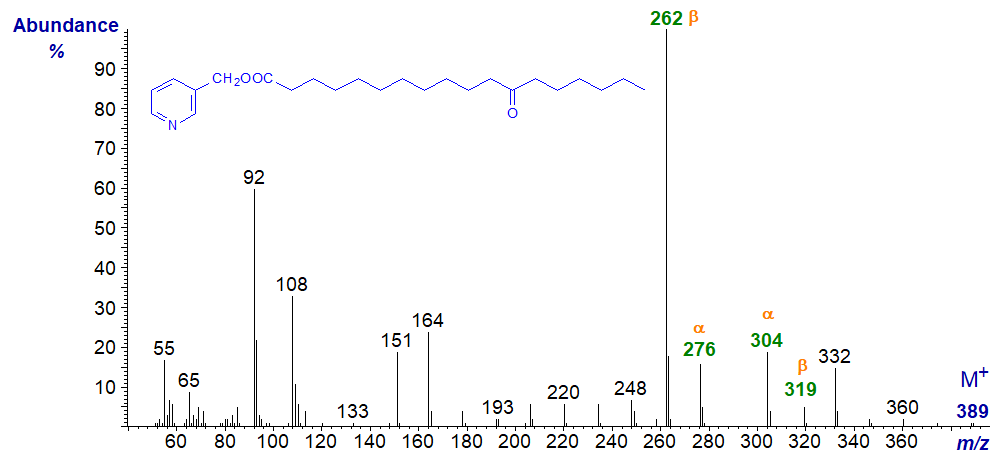
Note that as described in the web-page on mass spectra of methyl esters of oxo acids, this isomer is easily prepared as a standard from ricinoleic acid.
In the spectrum of 3-pyridylcarbinyl 13-oxo-octadecanoate, the key ions are shifted up by a further 14 amu -
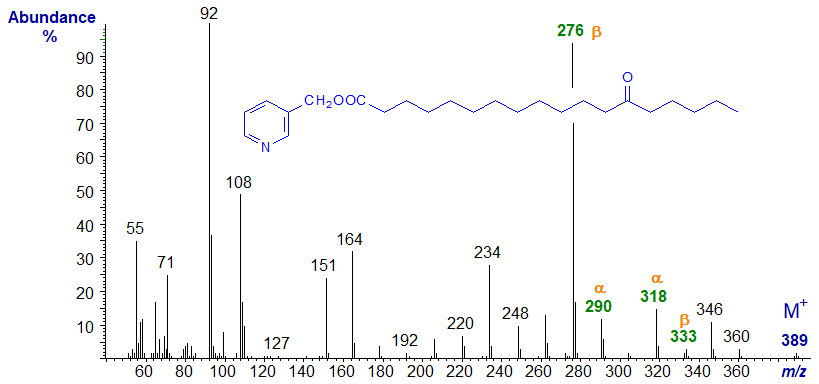
In the mass spectrum of 3-pyridylcarbinyl 16-oxo-octadecanoate, the key ions are shifted up by a further 42 amu, but the second of the beta cleavage ions (expected at m/z = 375) is not present.
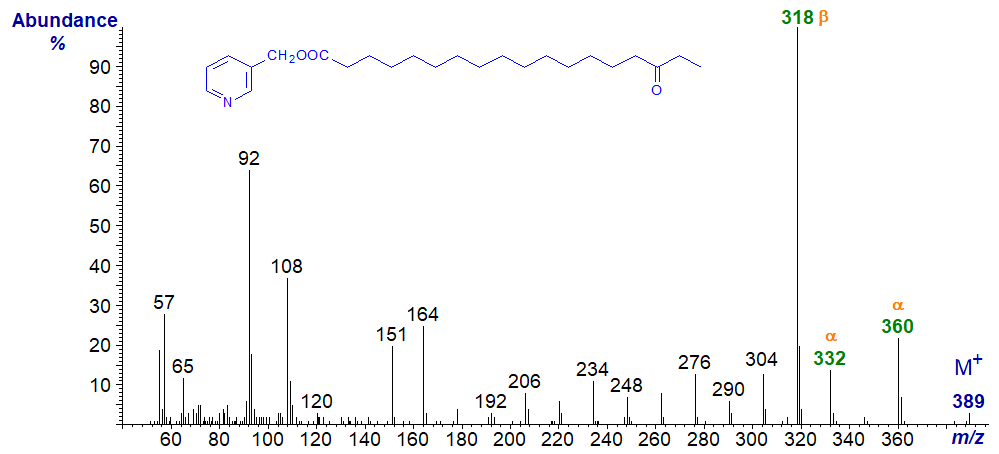
Mono-Unsaturated Oxo Fatty Acids
In the mass spectrum of 3-pyridylcarbinyl 10-oxo-octadec-14-enoate, the ions expected for cleavage at the 10-oxo group are present (see the spectrum of the saturated analogue above).
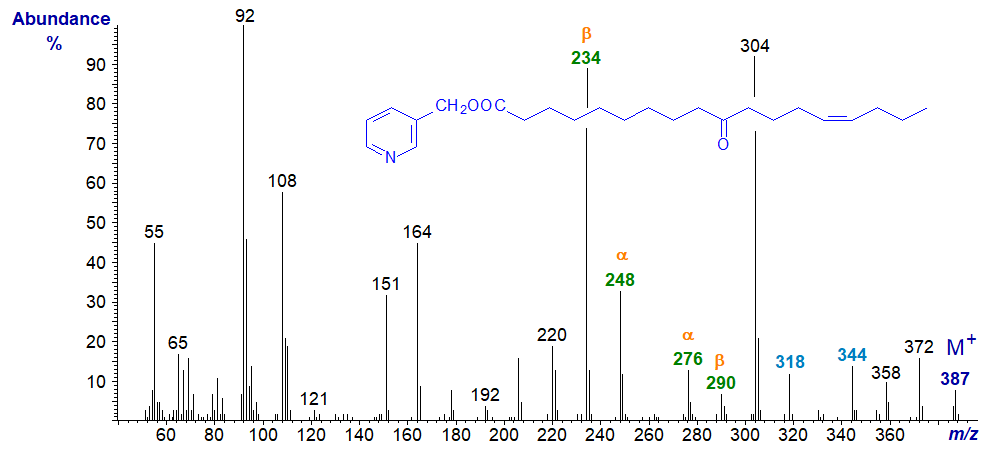
In addition, there are ions that serve to locate the double bond in position 14, i.e., by the gap of 26 amu between m/z = 318 and 344, while the ion formed by cleavage beta to the double bond at m/z = 304 is especially abundant as shown below. See the web page on 3‑pyridylcarbinol esters of monoenoic fatty acids for a full discussion of such fragmentations.
 |
| Fragmentation points in the mass spectrum of 3-pyridylcarbinyl 10-oxo-octadec-14-enoate. |
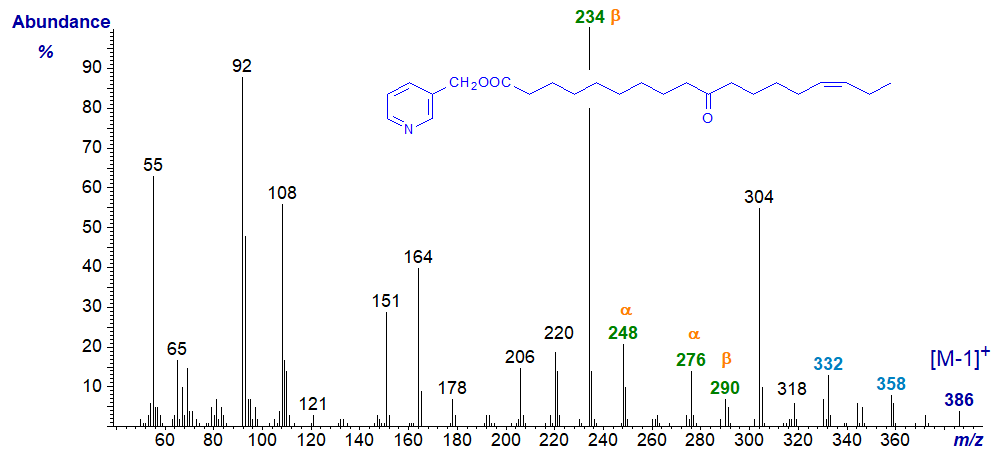
In the mass spectrum of the isomeric 3-pyridylcarbinyl 10-oxo-octadec-15-enoate in comparison (next), the same ions are present for fragmentation at the oxo group, but those for fragmentation at the double bond are shifted upwards by 14 amu to m/z = 332 and 358.
In the mass spectrum of 3-pyridylcarbinyl 12-oxo-octadec-5-enoate, the oxo group is located by the ions at m/z = 274, 288, 316 and 331, according to the principles described above. A double bond in position 5 is less easily located definitively, but the distinctive ion at m/z = 232 is a good guide. Note that in a superficial examination of the spectrum, the prominent ions at m/z = 274 and 288 might lead the observer to think that there was a double bond in position 9 for which these can be a signpost.

The next two isomers do indeed have a double bond in position 9, but with the oxo group in different positions. Both have the distinctive gap of 26 amu between m/z = 234 and 260 for the double bond, and the first has abundant ions at m/z = 274 and 288 that are also characteristic.
In the spectrum of 3-pyridylcarbinyl 16-oxo-octadec-9-enoate, the ions that serve to locate the oxo group are at m/z = 316, 330, 358 and 372, according to the principles set out above, and the ions that locate the double bond are highlighted on the spectrum.

Finally, the spectrum of 3-pyridylcarbinyl 12-oxo-octadec-9-enoate is anomalous in that the main cleavage occurs alpha not beta to the oxo group because of the presence of the adjacent double bond -

When faced with this as an unknown, the potential confusion was resolved by deuteration and re-analysis, and the chemical basis for this is discussed in greater detail in the section of these web pages dealing with mass spectra of fatty acid methyl esters - further derivatization. By eliminating the double bond while simultaneously 'fixing' it, its original position is confirmed and the position of the oxo-group is similarly clear, as is shown in the spectrum that follows, i.e., of 3‑pyridylcarbinyl 9,10-deutero-12-oxo-octadecanoate.

Thus, the ions at m/z = 234, 249 and 264 locate the double bond, while the base ion is at m/z = 264 for fragmentation beta to the oxo group. Compare this with the previous spectrum and that of the non-deuterated saturated analogue (Figure 4) above.
Mass spectra of further related fatty acids as 3-pyridylcarbinol esters are available, but without interpretation, in the Archive Section of these web pages.
References
- Brechany, E.Y. and Christie, W.W. Identification of the saturated oxo fatty acids in cheese. J. Dairy Res., 59, 57-64 (1992); DOI.
- Brechany, E.Y. and Christie, W.W. Identification of the unsaturated oxo fatty acids in cheese. J. Dairy Res., 61, 111-115 (1994); DOI.
- Tulloch, A.P. Mass spectrometry of pyrrolidides of oxo, hydroxy and trimethylsilyloxy octadecanoic acids. Lipids, 15, 881-888 (1980); DOI.
I recommend - Christie, W.W. and Han, X. Lipid Analysis - Isolation, Separation, Identification and Lipidomic Analysis (4th edition), 446 pages (Oily Press, Woodhead Publishing and now Elsevier) (2010) - at Science Direct.
| © Author: William W. Christie |  |
|
| Updated: June 2025 | Contact/credits/disclaimer | |
© The LipidWeb is open access and fair use is encouraged but not text and data mining, AI training, and similar technologies.
