Mass Spectrometry of Methyl Esters
Oxo (Keto) Fatty Acids
 As
with my other documents on mass spectrometry with electron-impact ionization, this is a subjective account that details only those fatty
acids relevant to this topic encountered during my research activities and for which we have spectra available for illustration purposes.
Spectra of methyl esters are described here, but I will only describe key diagnostic ions, as general mechanistic aspects are described
in other web pages on this site (see that on saturated derivatives).
While mass spectra of 3‑pyridylcarbinol derivatives
of these fatty acids are described in a separate document,
I have no spectra for DMOX or pyrrolidine derivatives, as I was not using these in my research at the time these spectra were obtained.
However, data have been published elsewhere for the complete series of oxo octadecanoates as pyrrolidides
(Tulloch, 1980).
Only a few of the spectra illustrated below have been published elsewhere, and all were obtained during studies of minor fatty acid constituents of milk and cheese with my collaborator at that time, Elizabeth Brechany (in the picture) (Brechany and Christie, 1992 and 1994). In total we identified 51 different oxo fatty acids (though only a few as the methyl esters) of which half were new to science. There seemed to be no obvious pattern in their formation, and their biosynthetic origin is not known.
As might be expected, the information that can be gleaned from spectra of methyl esters is limited in comparison to 3-pyridylcarbinol derivatives. That said, it is not difficult to identify saturated oxo acids in the form of the methyl esters by mass spectrometry, as it has long been known that the key diagnostic ions in mass spectra of methyl ester derivatives of oxo (keto) fatty acids are formed by cleavage both alpha and beta to the oxo group (Ryhage and Stenhagen, 1960; Kenner and Stenhagen, 1964), although other rearrangement ions can confuse this simple picture, a common finding with mass spectra of methyl esters. This is not a mechanistic treatise, so my interpretations are intended as a practical guide and are intentionally over-simplified.
Mass spectrum of methyl 5-oxo-stearate (octadecanoate) -
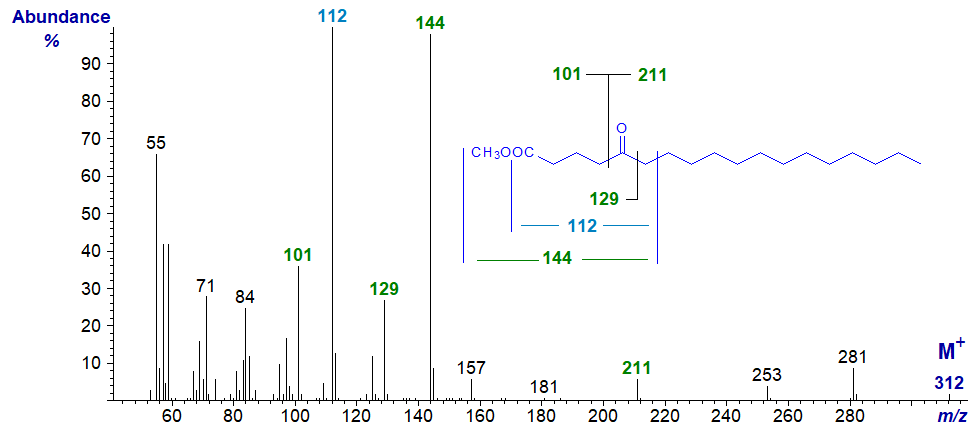
In this example, the main fragment ion at m/z = 144 is formed by beta cleavage between carbons 6 and 7 (and containing the carboxyl moiety), while less abundant ions at m/z = 101, 129 and 211 are formed by cleavage alpha to the oxo group as illustrated. The ion at m/z = 112 is presumably formed from that at m/z = 144 by elimination of the elements of methanol. The molecular ion is small but sufficient for identification purposes, and this appears to be typical for other isomers.
Mass spectrum of methyl 7-oxo-stearate (see Ryhage and Stenhagen, 1960) -
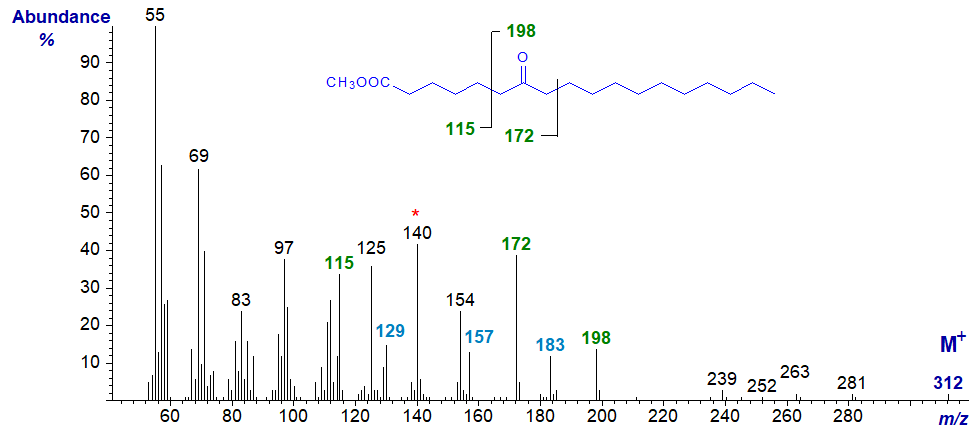
Here, the ion at m/z = 172 is formed by beta cleavage between carbons 8 and 9 (that at m/z = 140 represents loss of methanol from this) at the carboxyl end of the molecule, and those at m/z = 115 and 198 are for cleavage between carbons 5 and 6. The expected alpha cleavage ions (m/z = 129, 157 and 183) are less abundant but distinct.
Mass spectrum of methyl 12-oxo-stearate -
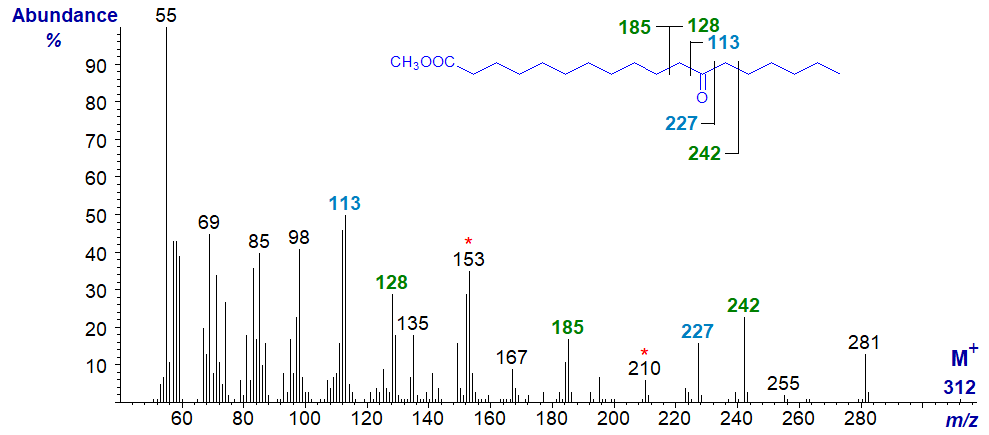
In this instance, the beta cleavage ions containing the carboxyl group are at m/z = 185 and 242 (with corresponding ions for loss of methanol at m/z = 153 and 210, respectively) and m/z = 128 for the terminal part of the molecule, with the alpha cleavage ions as marked.
Note that a pure standard of this fatty acid was readily obtainable for comparison purposes by hydrogenation and then oxidation of ricinoleic acid (12‑hydroxy-octadec-9-enoate) from castor oil. It was also possible to deuterate this acid prior to hydrogenation to produce methyl 9,10‑dideutero-12-oxo-octadecanoate (next spectrum) as an aid to confirming the identity of the various fragments and understanding the fragmentation mechanisms. I will leave the latter task as an exercise for the reader, but it should soon become evident that the apparently simple fragmentations that I have highlighted are in fact somewhat more complex. Ignore the differences in intensity of the ion at m/z = 55, which are due to instrumental factors.
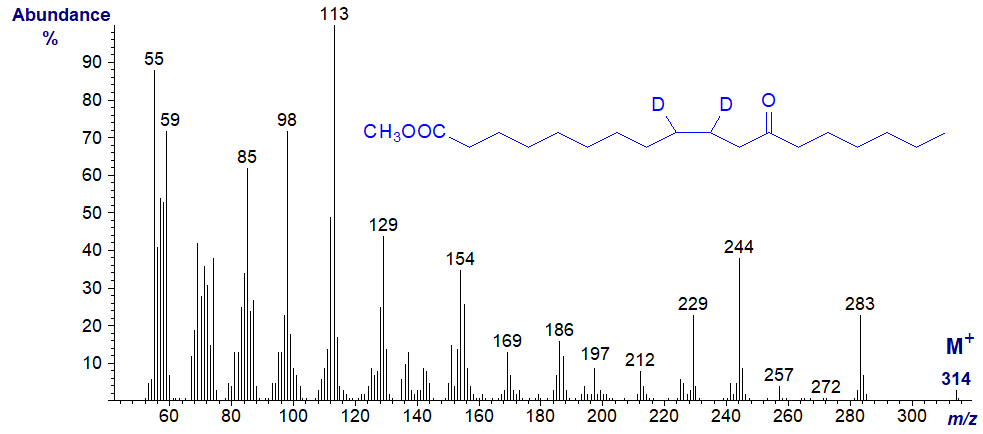
The mass spectrum of methyl 12-oxo-octadec-9-enoate -
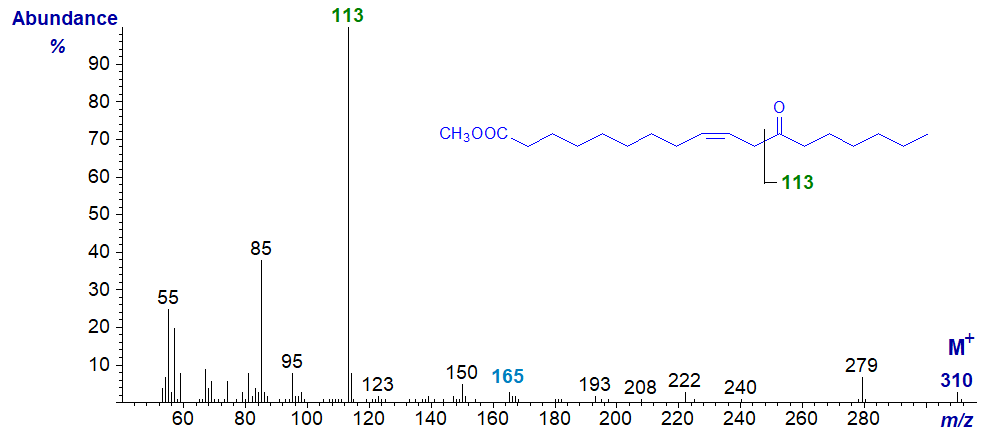
Again, it was a simple task to prepare this fatty acid from ricinoleate as a standard. In this instance, the double bond obviously has a major influence on fragmentation and the spectrum is dominated by the ion at m/z = 113, formed from the terminal end of the molecule by cleavage alpha to the oxo group and beta to the double bond, i.e., between carbons 11 and 12. Any dubiety regarding the identification was removed by the analysis of the deuterated derivative. With most other monoenoic isomers of this kind, I would not expect to find any ions indicative of the double bond position. While I could speculate on the origins of the ions at m/z = 85, 95 and 240, I hesitate to put such speculations in print in case they are then given too much credence. It is not easy to identify any ions from the carboxyl end of the molecule, but it is tempting to suggest that the small ion at m/z = 165 may represent the other alpha cleavage ion on the carboxyl side following elimination of the elements of methanol.
Oxime derivatives
The mass spectrum of the oxime derivative of methyl 12-oxo-stearate is even more confusing, and it is illustrated below for record purposes only. The spectrum appears to be dominated by nitrogen-containing ions, with fragments from both ends of the molecule. Some of these may have lost the oxygen atom from the oxime group, so more detailed interpretation would be speculative. It was obvious that preparation of oxime derivatives did not assist structural analyses.
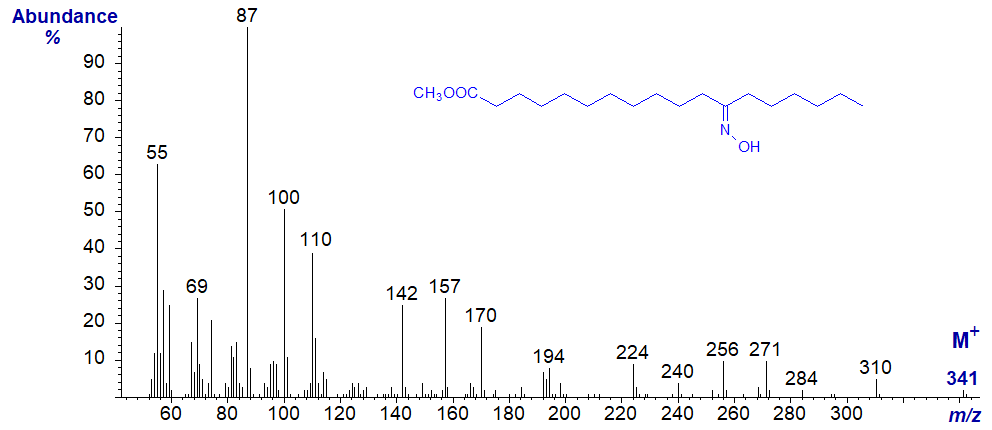
Further mass spectra of oxime derivatives are available in the Archive Section of these web pages, and a spectrum of the plant oxylipin methyl 12‑oxophytodienoate is available.
References
- Brechany, E.Y. and Christie, W.W. Identification of the saturated oxo fatty acids in cheese. J. Dairy Sci., 59, 57-64 (1992); DOI.
- Brechany, E.Y. and Christie, W.W. Identification of the unsaturated oxo fatty acids in cheese. J. Dairy Res., 61, 111-115 (1994); DOI.
- Kenner, G.W. and Stenhagen, E. Location of double bonds by mass spectrometry. Acta Chem. Scand., 18, 1551-1552 (1964); DOI.
- Ryhage, R. and Stenhagen, E. Mass spectrometric studies. VI. Methyl esters of normal chain oxo-, hydroxy-, methoxy- and epoxy-acids. Arkiv Kemi, 15, 545-574 (1960).
- Tulloch, A.P. Mass spectrometry of pyrrolidides of oxo, hydroxy and trimethylsilyloxy octadecanoic acids. Lipids, 15, 881-888 (1980); DOI.
I can recommend - Christie, W.W. and Han, X. Lipid Analysis - Isolation, Separation, Identification and Lipidomic Analysis (4th edition), 446 pages (Oily Press, Woodhead Publishing and now Elsevier) (2010) - from Science Direct.
| © Author: William W. Christie |  |
|
| Updated: June 2025 | Contact/credits/disclaimer | |
© The LipidWeb is open access and fair use is encouraged but not text and data mining, AI training, and similar technologies.
