Mass Spectrometry of Methyl Esters
Acetylenic Fatty Acids
As with other documents in this section, this is a subjective account of mass spectrometry with electron-impact ionization of methyl esters of acetylenic fatty acids but detailing only those encountered during our research activities here and for which we have spectra available for illustration purposes. However, I trust that we have a wider range of spectra than are likely to be encountered elsewhere. Many have never been published formally, but I cite references to prior publications when these are known to us. Spectra of methyl esters only are described in this document, and those for 3-pyridylcarbinol ('picolinyl') esters and for DMOX derivatives with pyrrolidides are described in separate web pages. Spectra of highly unsaturated acetylenic fatty acids are rarely easy to interpret, and a common failing is to attempt to see more in a spectrum than may be justified. While there is some essential mechanistic information in our web page on methyl esters of saturated fatty acids, it is often useful to simply treat a mass spectrum as a 'fingerprint' for comparison purposes, and I consider this web page to be mainly a practical guide. Another potential problem is that such fatty acids can isomerize and oxidize readily on derivatization or if handled carelessly. The chemistry and occurrence of natural acetylenic fatty acids are discussed in the Lipid Essentials section of this website.
Monoynoic Fatty Acids
The mass spectrum of methyl octadec-9-ynoate (stearolate) illustrated first is not especially distinguished. It was first published by Odham and Stenhagen (1972), but the most comprehensive description of mass spectrometry of methyl esters of acetylenic fatty acids is by Kleiman et al. (1976), whose tabulated data are invaluable for interpretation of the spectra. This spectrum differs in significant ways from that of methyl linoleate, which has the same molecular weight.
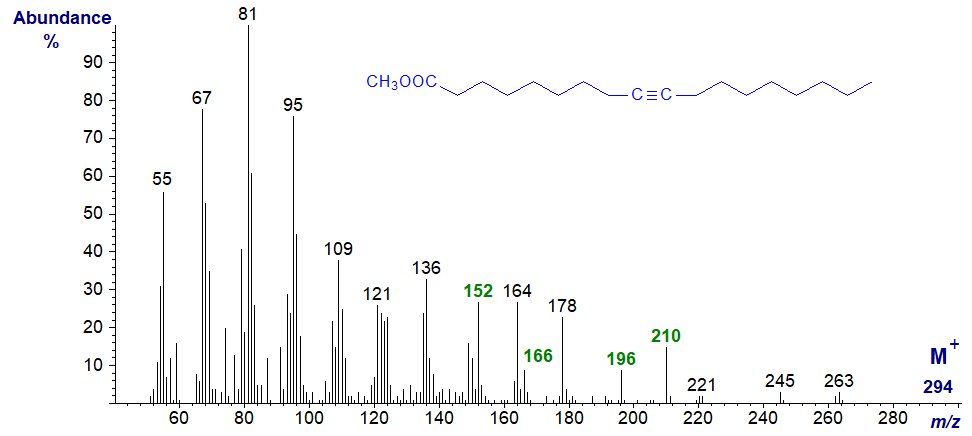
The molecular ion at m/z = 294 is barely detectable, but there are several key ions that are reported to have diagnostic relevance. The ions at m/z = 152 and 196 are believed to have rearranged to form allenic structures (see our web page on mass spectrometry of allenic fatty acids), with the latter as [CH3OOC(CH2)7CH=C=CH2]+, for example . The ions at m/z = 166 and 210 have rearranged to produce conjugated dienes, with the second of these represented by − [CH3OOC(CH2)7CH=CHCH=CH2]+.
The other naturally occurring mono-acetylenic acid is octadec-6-ynoic (tariric) acid, found in seed oils of the genus Picramnia. Methyl octadec-6-ynoate has the spectrum -
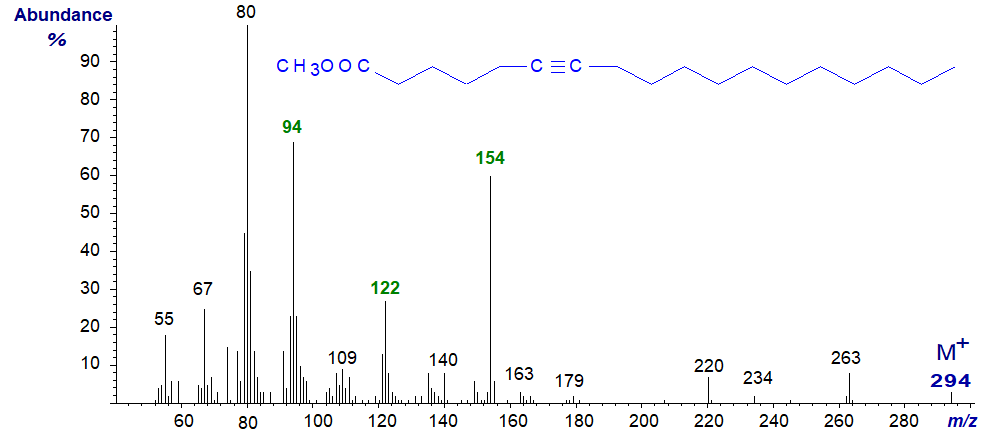
In this instance, the defining ion is that at m/z = 154 (together with that at m/z = 122, representing a further loss of methanol) from the favoured rearrangement to form the allenic fragment − [CH3OOC(CH2)3CH=C=CH2]+. In fact, this spectrum is extraordinarily similar to that of the allenic methyl octadeca-5,6-dienoate (see our web page on mass spectrometry of allenic fatty acids, where the ion at m/z = 94 is also discussed).
Alternative Derivatization Techniques
As interpretation of mass spectra of methyl esters of acetylenic fatty acids is rarely straightforward, it can be useful to consider alternative derivatization procedures. One that is especially useful for isolated triple bonds, is mercuration-demercuration. The procedure involves reaction of the acetylenic derivative with mercuric acetate in methanol to form mercury adducts, followed by treatment with acid to remove the mercury groups. In this instance, the demercuration reaction is not fully reversible (in contrast to the reaction with double bonds), and ketones are formed by addition of the elements of water (Bu'Lock and Smith, 1967). I have not tried this reaction myself, but it seems straightforward. Kleiman et al. (1976) recommend further steps, i.e., to reduce the ketones to hydroxyls with sodium borohydride and conversion to trimethylsilyl ethers prior to GC-MS.
 |
| Figure 3. Mercuration-demercuration reaction with triple bonds. |
A more useful and perhaps simpler general technique is to perform deuteration with Wilkinson's catalyst. Four deuterium atoms are then added to triple bonds, and these can then be identified easily by GC-MS. Note that the reaction is best performed on the methyl ester derivative, but this must be converted subsequently to the 3-pyridylcarbinol ester or DMOX derivative for analysis. The last two are preferred for mass spectrometry as they give more even fragmentations with fewer rearrangements. This reaction helped us identify a conjugated acetylenic acid in the seed oil of Tanacetum corymbosum (Tsevegsuren et al., 1998). See the section of this website on Mass spectra of methyl esters of fatty acids - further derivatization for a detailed protocol and the mass spectrum.
 |
| Figure 4. Deuteration of acetylenic bonds. |
Diynoic Fatty Acids
We had access some years ago to a comprehensive series of bis-methylene-interrupted and conjugated diynoic fatty acids prepared by M.S.F. Lie Ken Jie and colleagues, and details of the mass spectra of the 3-pyridylcarbinol ester derivatives (only) were published (Christie et al., 1988). For most scientists, these are likely to be of limited academic interest, so two representative examples only of spectra of the methyl ester derivatives are shown below (the remainder are available in our Archive section). Spectra of polyacetylenic fatty acids are rarely easy to interpret, as triple bonds rearrange in complex ways under electron bombardment. Mass spectra of methyl 9,11-octadecadiynoate (top) and 10,12‑octadecadiynoate (bottom) -
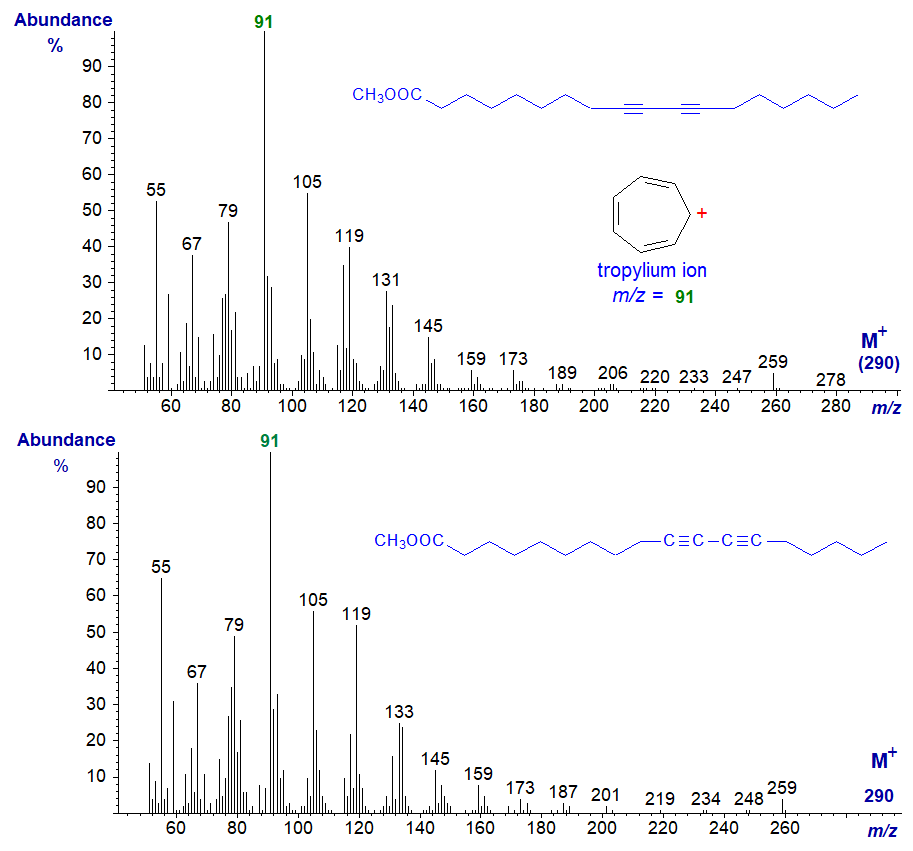
The two spectra are identical in essence. In both, the molecular ions are barely detectable, and the base ion at m/z = 91 presumably reflects a rearrangement to form a stable tropylium ion (see the web page on mass spectrometry of methyl esters of tetraenoic fatty acids). Spectra of other isomers as the methyl esters are indistinguishable from this.
Methylene-Interrupted Ene-ynoic Fatty Acids
Crepenynic or octadec-9-en-12-ynoic acid is a major constituent of some seed oils and is important as a biosynthetic precursor of a family of secondary metabolites. The mass spectrum of its methyl ester is -
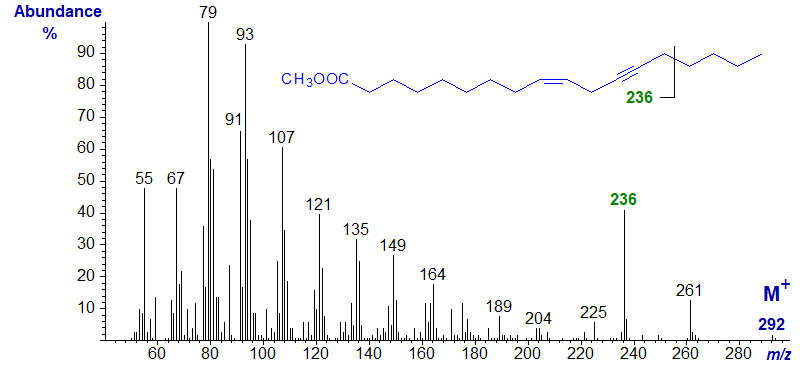
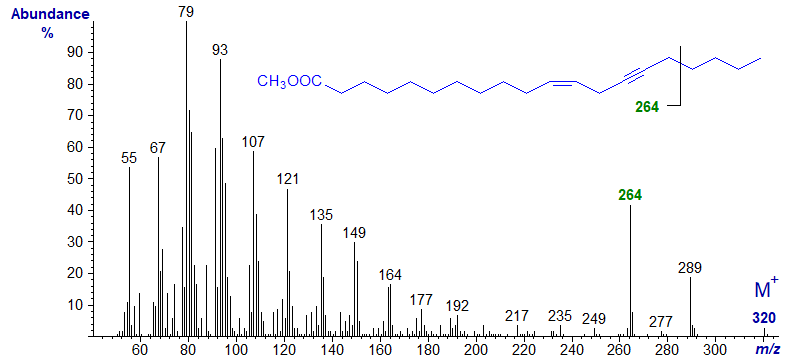
As with other methyl esters, little structural information can be gleaned from the spectrum, although it has a distinctly different fingerprint from fatty acids with the same molecular weight, e.g., the various linolenic acid isomers. The ion at m/z = 236 (equivalent to [M−56]+) does appear to be distinctive. The likeliest if simplistic explanation for its origin is that it is formed by cleavage of the terminal four carbon atoms beta to the triple bond (see the next spectrum and that of methyl octadeca-8,10-dien-12-ynoate below).
The same is true of its C20 homologue, methyl eicos-11-en-14-ynoate in which the last ion is now 28 amu higher at m/z = 264, confirming its probable origin -
Octadeca-6,9-dien,12-ynoic acid was produced from crepenynic acid by a Δ6 desaturase on incubation with the cyanobacterium Spirulina platensis (author, unpublished). Methyl octadeca-6,9-dien,12-ynoate has the next spectrum. Other than offering it as a fingerprint, little further interpretation is possible. The tropylium ion (m/z = 91) is now the base ion, and there are abundant ions related to this (in 14 amu steps) at m/z = 105, 119, 113 and so forth.
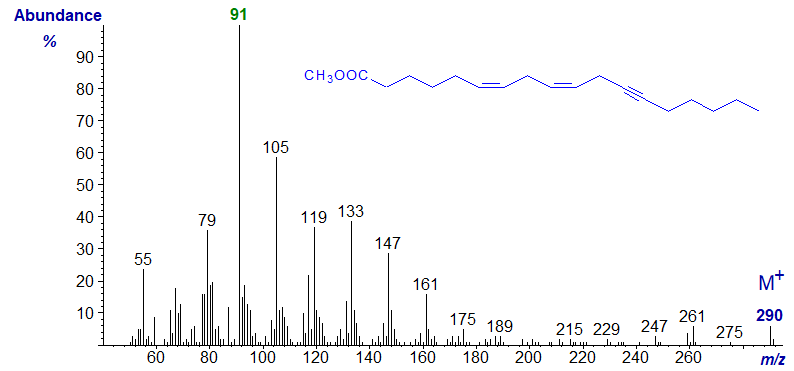
The spectrum of the homologous methyl eicosa-8,11-dien-14-ynoate (in our Archive) from the same source closely resembles this, although the ions in the high mass range are of course 28 amu higher.
Conjugated Ene-ynoic Fatty Acids
Octadeca-9-yn,11-trans-enoic (ximenynic or santalbic) acid is a component of certain seed oils, such as Ximenia americana. The methyl ester has the following mass spectrum -
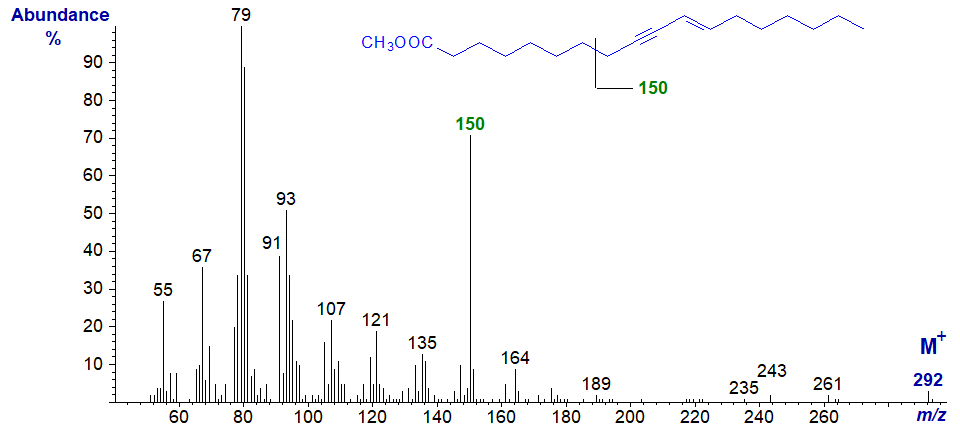
The molecular ion is not very abundant, but the tropylium ion at m/z = 91 does stand out. A distinctive and diagnostic feature is the ion at m/z = 150, normally considered to be characteristic of polyunsaturated fatty acids of the (n-6) family. It is presumably formed from the terminal end of the molecule by cleavage between carbons 7 and 8, as it is prominent in the mass spectrum of the homologous methyl eicos-11-yn,13-trans-enoate illustrated next and in those of higher homologues (up to C26 - see our Archive). Both spectra were illustrated here first before being published formally by others.

We have spectra of two natural fatty acids with one triple bond in conjugation with two double bonds. Each has one distinctive fragment ion that depends on whether the triple bond is closest or furthest from the carboxyl group. In each case, it is produced by a fragmentation beta to the triple bond. Analogous fragments can be seen in the spectra of the relevant monoene-yne derivatives illustrated earlier.
First, the mass spectrum of methyl octadeca-9-yn,11-trans,13-cis/trans-dienoate from the seed oil of a Ximenia species (not published elsewhere) -

The distinctive ion at m/z = 148 is presumably formed by cleavage beta to the unsaturated system, by analogy with a comparable fragmentation in the spectrum of methyl ximenynate above, i.e., containing the hydrocarbon part of the molecule.
Secondly, the mass spectrum of methyl octadeca-8,10-dien,12-ynoate from Tanacetum corymbosum seed oil (Tsevegsuren et al., 1998) -

By analogy with the spectrum of methyl crepenynate above, I suggest that the ion at m/z = 234 may be formed by cleavage of the terminal four carbon atoms. This appears to be the only distinctive feature in the spectrum, i.e., containing the carboxyl end of the molecule. The spectrum of the fully deuterated ester necessary for its initial characterization is discussed here...
Further mass spectra of acetylenic fatty acids in the form of the methyl esters are available, but without interpretation, in the Archive Section of these web pages.
References
- Bu'Lock, J.D. and Smith, G.N. The origin of naturally-occurring acetylenes. J. Chem. Soc. (C), 332-336 (1967); DOI.
- Christie, W.W., Brechany, E.Y. and Lie Ken Jie, M.S.F. Mass spectra of the picolinyl ester derivatives of some isomeric dimethylene-interrupted octadecadiynoic acids. Chem. Phys. Lipids, 46, 225-229 (1988); DOI.
- Kleiman, R., Bohannon, M.B., Gunstone, F.D. and Barve, J.A. Mass spectra of acetylenic fatty acid methyl esters and derivatives. Lipids, 11, 599-603 (1976); DOI.
- Odham, G. and Stenhagen, E. Fatty acids. In: Biochemical Applications of Mass Spectrometry, pp. 211-228 (Ed. G.R. Wallace, Wiley, N.Y.) (1972).
- Tsevegsuren, N., Christie, W.W. and Lösel, D. Tanacetum (Chrysanthemum) corymbosum seed oil: a rich source of a novel conjugated acetylenic acid. Lipids, 33, 723-727 (1998); DOI.
I can recommend - Christie, W.W. and Han, X. Lipid Analysis - Isolation, Separation, Identification and Lipidomic Analysis (4th edition), 446 pages (Oily Press, Woodhead Publishing and now Elsevier) (2010) - from Science Direct.
| © Author: William W. Christie |  |
|
| Updated: May 2025 | Contact/credits/disclaimer | |
© The LipidWeb is open access and fair use is encouraged but not text and data mining, AI training, and similar technologies.
