Mass Spectrometry of Methyl Esters
Epoxy, Furanoid and Alkoxy Fatty Acids
As with my other documents on mass spectrometry, this is a subjective account that details only those relevant fatty acids encountered during our research activities and for which we have spectra available for illustration purposes; I have no experience of eicosanoids. Methyl esters are often the first choice for analysis and identification of unknown fatty acids, including those with epoxy or similar functional moieties, and they can afford definitive identifications, especially with structural features other than double bonds, although they are rarely the best for the purpose. 3‑Pyridylcarbinol ('picolinyl') esters, pyrrolidides and DMOX derivatives have some advantages, but I have no definite feelings on which of these is best for these fatty acids, simply because insufficient model spectra are available. My general philosophy is to always to prepare more than one derivative, when possible. In this document, the spectra of methyl esters are discussed, while mass spectra of 3‑pyridylcarbinol esters and of DMOX and pyrrolidine derivatives are described in separate web pages, and all are intended as practical rather than mechanistic guides. Prior publications are cited here when they are known to me. There is an account of the natural occurrence of oxygenated fatty acids, other than eicosanoids, in the Lipid Essentials section.
Epoxy Fatty Acids
Mass spectra of three epoxy fatty acids that occur naturally in certain seed oils are described below. Note that care must be taken in preparing the derivatives for mass spectrometry, as strong acids can cause ring opening.
The mass spectrum of methyl 9,10-epoxy-octadecanoate -
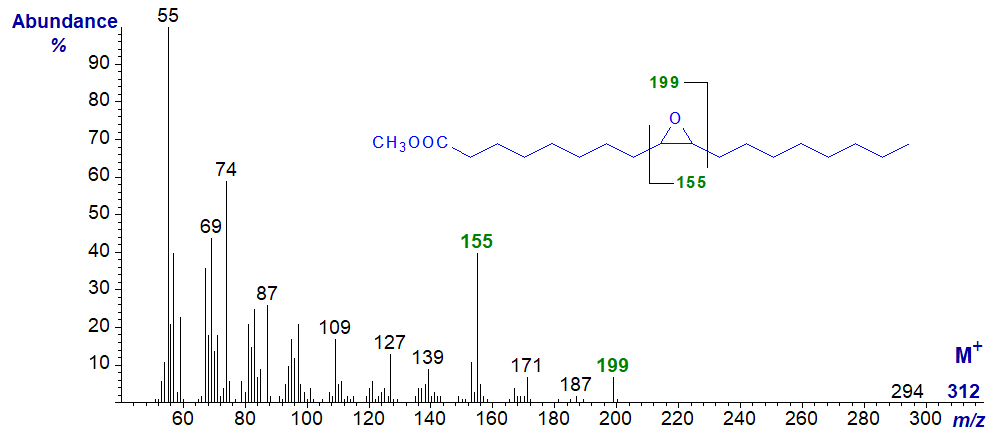
The molecular ion (m/z = 312) is just detectable, but the McLafferty ion at m/z = 74 is prominent, as expected for a saturated derivative (see our web page on methyl esters of saturated fatty acids). The most useful diagnostic ion is that at m/z = 155, i.e., the ion formed from the terminal part of the molecule after cleavage between carbons 8 and 9. The ion at m/z = 199 reflects cleavage between carbons 10 and 11 (including the carboxyl group) (Ryhage and Stenhagen, 1960). Although the relative abundances differ, the same ions are present in the spectrum of the trimethylsilyl ether derivative of methyl 9,10‑epoxy,18-hydroxy-octadecanoate from plant suberin in our Archive section.
The mass spectrum of methyl 12,13-epoxy-octadec-9-enoate or vernolate, which was the first natural epoxy fatty acid to be characterized (by my mentor - the eminent lipid chemist F.D. Gunstone) follows; this sample was from the seed oil of Vernonia galamensis.
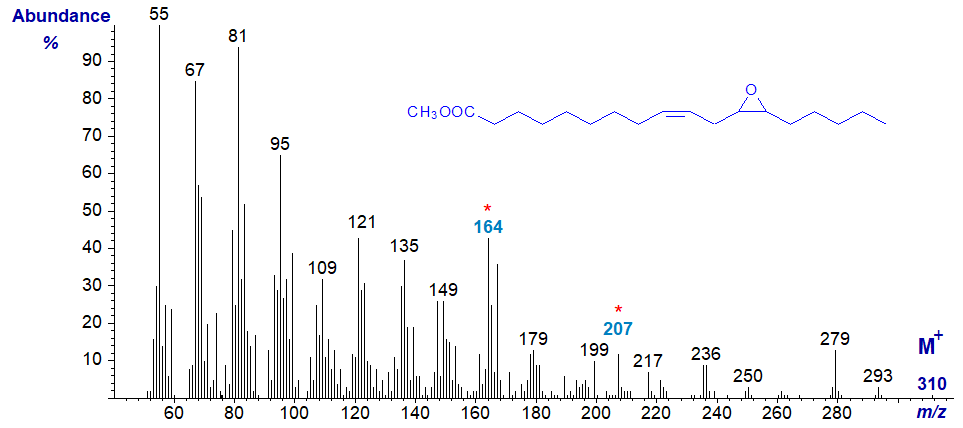
Again, the molecular ion is very small. It is possible to speculate that the ions at m/z = 164 and 207 reflect cleavage on either side of the ring, after loss of the methanol group, but in general the spectrum is best regarded as a fingerprint. With methyl esters, many analysts have resorted to ring opening procedures prior to mass spectrometry as a better means of locating the epoxide ring.
Methyl 9,10-epoxy-octadec-12-enoate or coronarate, a natural isomer of vernolic acid from Xeranthemum annuum seed oil, has the mass spectrum -
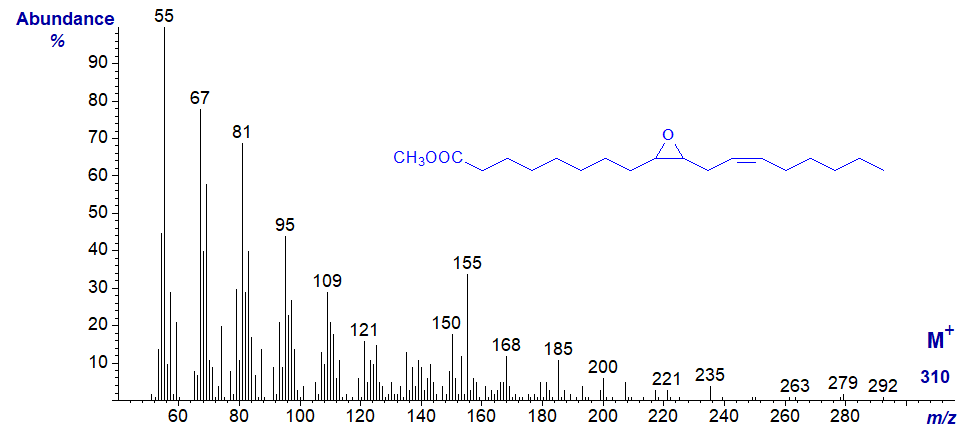
The origin of the ion at m/z = 155 may be the same as in the first spectrum above, but while it would be possible to speculate regarding other ions, I am reluctant to do this in print in case the speculation receives spurious legitimacy. The spectrum is again best regarded simply as a fingerprint (see Kleiman and Spencer, 1973).
3-Pyridylcarbinol esters and DMOX derivatives give more useful spectra that permit definitive location of both the double bond and epoxy group.
Furanoid Fatty Acids
Furanoid fatty acids with methyl substituents on the ring occur naturally in small amounts in plant lipids including algae and certain seed oils, and via the food chain, they are present in small amounts in animal tissues and especially those of fish. The simplest natural furanoid fatty acid, 8-(5-hexyl-2-furanyl)-octanoic or 9,12‑epoxy-octadeca-9,11-dienoic acid has been found in plants, fish and some bacteria, but it can be formed on autoxidation of conjugated dienoic acids, e.g., 9Z,11E-octadecadienoic acid; the material used for the spectrum below was from Matreya Inc. (U.S.A.). The methyl ester has the spectrum illustrated next -
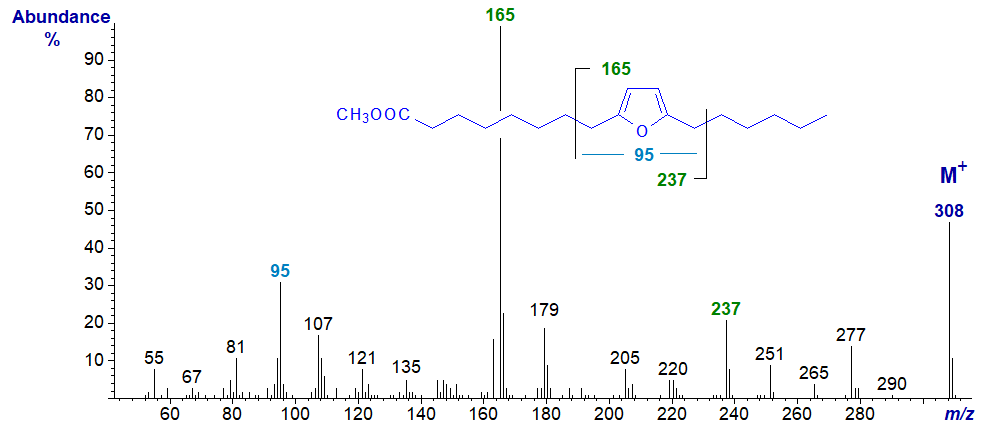
The base peak at m/z = 165 presumably represents the ion formed by cleavage beta to the furanoid ring between carbons 7 and 8 while the ion at m/z = 237 is formed by a beta cleavage on the other side of the ring (Yurawecz et al., 1995). The ion at m/z = 95 is a fragment containing the furan ring and the two adjacent carbon atoms as illustrated. The full spectrum of a positional isomer of this fatty acid has been illustrated by Yurawecz et al. (1997).
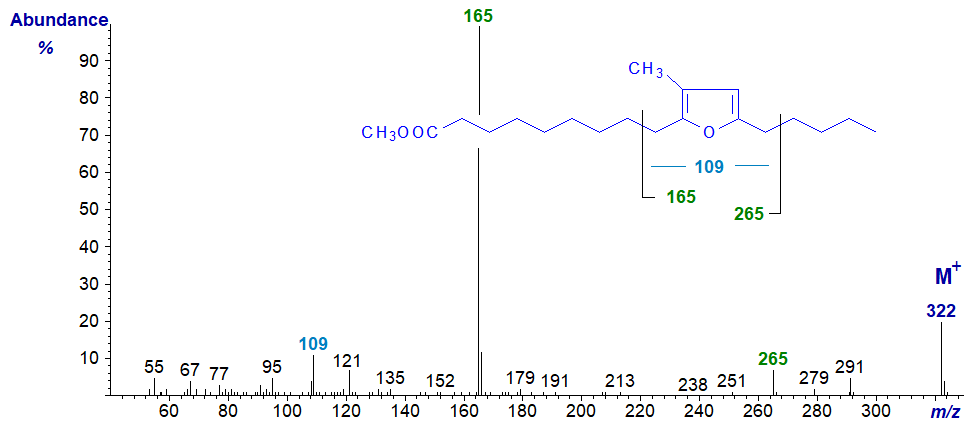
Furanoid fatty acids, with one or two methyl groups attached to the furan ring, occur as minor components of fish oils, where they almost certainly originate in algae as part of the marine food chain, and they have also been reported as minor component of the lipids of higher plants. The spectrum of methyl 10,13‑epoxy-11-methyl-octadecadienoate with one methyl group is -
- and that of methyl 10,13-epoxy-11,12-dimethyl-octadecadienoate with two methyl groups is –
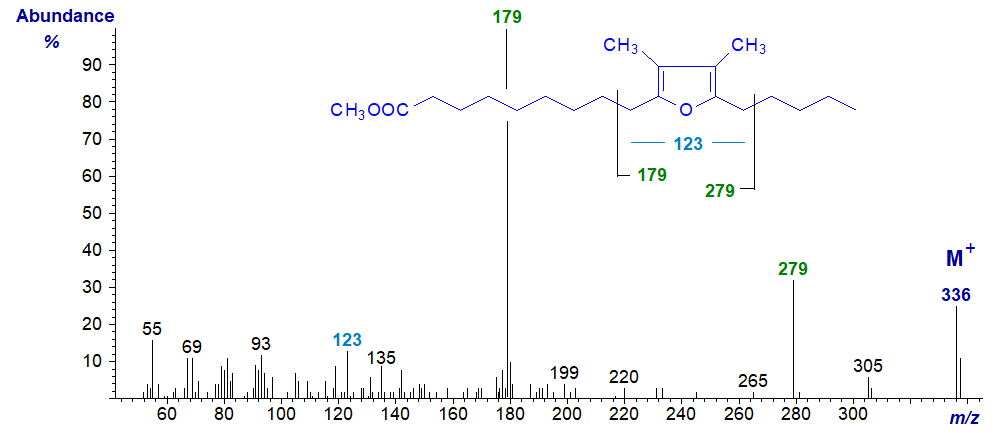
Perhaps surprisingly, the mass spectra of the methyl esters are sufficiently informative for most practical purposes, as they define the position of the ring and the number of attached methyl groups. The positions of the rings are clearly delineated by fragmentations beta to the rings as illustrated, while the presence of one or two methyl groups is determined by ions at m/z = 109 or 123, respectively (cf., the corresponding ion at m/z = 95 in the spectrum of the unbranched compound above). The ion at m/z = 123 is often accompanied by a small ion at m/z = 109, but not vice versa. Glass et al. (1975) appear to be the first to illustrate and discuss such spectra, but they have been followed by many others. Wendlinger et al. (2016) and Müller et al. (2023) describe the spectra of furanoid fatty acids with further double bonds in the alkyl chain. The position of the methyl branch in the mono-methyl compound cannot be determined from the spectrum, but this can be accomplished following hydrogenation.
Methyl 10,13-epoxy-11-methyl-hexadecadienoate has the spectrum -
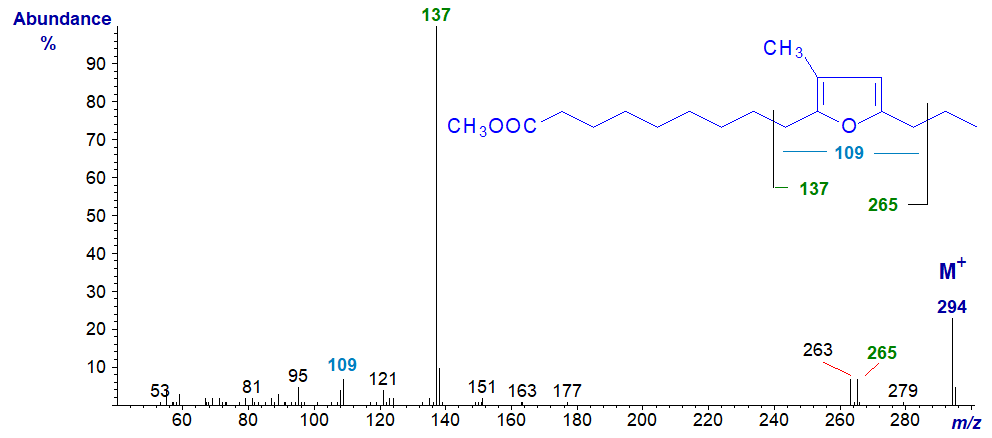
The ions at m/z = 137 and 265 locate the furan ring, while that at m/z = 109 confirms that there is only one methyl group attached to the ring.
In the spectrum of the analogous fatty acid with two methyl groups in the ring, i.e., of methyl 10,13-epoxy-11,12-dimethyl-hexadecadienoate, ions at m/z = 151 and 279 locate the furan ring, while that at m/z = 123 confirms that there are now two methyl groups attached to the ring.
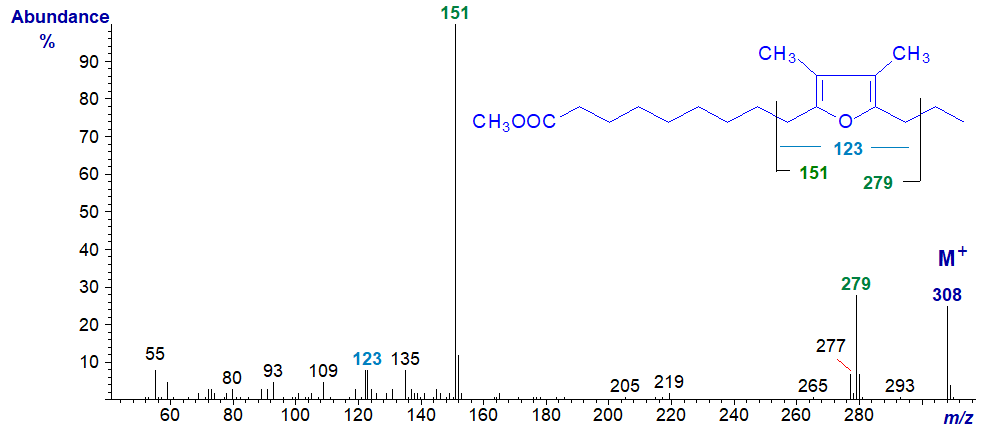
As a practical point when searching for furanoid fatty acids in complex marine samples, it can be helpful to do a selective ion search for the ions at m/z = 137, 151, 165 and 179, which in my experience should enable the analyst to find those most often encountered. It helps to have authentic spectra available for comparison, and there are more available on our Archive page, but without interpretation. A fraction enriched in furanoid esters can be obtained by silver ion chromatography; they elute just behind saturated derivatives.
Alkoxy Fatty Acids
Methoxy fatty acids are often found in the lipids of marine invertebrates and in some bacteria, but rarely elsewhere. The only one for which we have a spectrum on file was synthesised from ricinoleic acid from castor oil, i.e., methyl 12-methoxy-octadec-9-enoate -
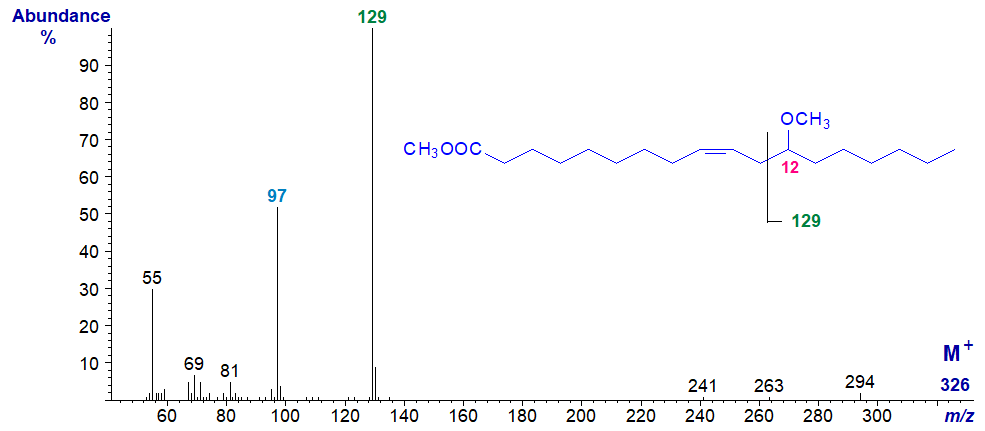
There is a very simple cleavage pattern between carbons 11 and 12, probably facilitated by the presence of the adjacent double bond, to yield the ion at m/z = 129, which presumably loses the elements of methanol from the 12-methoxyl group to give the ion at m/z = 97. Supporting evidence comes from the spectrum of the pyrrolidide derivative, which contains the ion at m/z = 129.
References
- Bauer, V., Haspel, T., Beifuss, U. and Vetter, W. Methyl substituted long chain 1,4-O-bridged-1,3-dienes-novel suitable internal standards for the GC/MS analysis of furan fatty acids in fish oil. J. Am. Oil Chem. Soc., 102, 1525-1533 (2025); DOI.
 Glass, R.L.,
Krick, T.P., Sand, D.M., Rahn, C.R. and Schlenk, H. Furanoid fatty acids from fish lipids.
Lipids, 10, 695-702 (1975); DOI.
Glass, R.L.,
Krick, T.P., Sand, D.M., Rahn, C.R. and Schlenk, H. Furanoid fatty acids from fish lipids.
Lipids, 10, 695-702 (1975); DOI.- Kleiman, R. and Spencer, G.F. Gas chromatography-mass spectrometry of methyl esters of unsaturated oxygenated fatty acids. J. Am. Oil Chem. Soc., 50, 31-38 (1973); DOI.
- Müller, F., Hammerschick, T. and Vetter, W. Geometrical and positional isomers of unsaturated furan fatty acids in food. Lipids, in press (2023); DOI.
- Ryhage, R. and Stenhagen, E. Mass spectrometric studies. VI. Methyl esters of normal chain oxo-, hydroxy-, methoxy- and epoxy-acids. Arkiv Kemi, 15, 545-574 (1960).
- Wendlinger, C., Hammann, S. and Vetter, W. Detailed study of furan fatty acids in total lipids and the cholesteryl ester fraction of fish liver. Food Anal. Methods, 9, 459-468 (2016); DOI - and references cited therein.
- Yurawecz, M.P., Hood, J.K., Mossoba, M.M., Roach, J.A.G. and Ku, Y. Furan fatty acids determined as oxidation products of conjugated octadecadienoic acid. Lipids, 30, 595-598 (1995); DOI.
- Yurawecz, M.P., Sehat, N., Mossoba, M.M., Roach, J.A.G. and Ku, Y. Oxidation products of conjugated linoleic acid and furan fatty acids. In: New Techniques and Applications in Lipid Analysis, pp. 183-215 (edited by R.E. McDonald and M.M. Mossoba, AOCS Press, Champaign) (1997)
I can recommend - Christie, W.W. and Han, X. Lipid Analysis - Isolation, Separation, Identification and Lipidomic Analysis (4th edition), 446 pages (Oily Press, Woodhead Publishing and now Elsevier) (2010) - from Science Direct.
| © Author: William W. Christie |  |
|
| Updated: November 2025 | Contact/credits/disclaimer | |
© The LipidWeb is open access and fair use is encouraged but not text and data mining, AI training, and similar technologies.
