Mass Spectrometry of Dimethyloxazoline and Pyrrolidine Derivatives
Hydroxy Fatty Acids
We have a limited range of mass spectra of dimethyloxazoline (DMOX) and pyrrolidide derivatives of hydroxy fatty acids available for illustrative purposes and then mainly from standards or well-defined natural sources, so this is an incomplete review of the topic (I can only discuss spectra which were encountered in my own research). As described in other web pages, in spite of having very different structures, dimethyloxazoline and pyrrolidide derivatives of a given fatty acid have identical molecular weights and fragment in a similar way in the mass spectrometer under electron-impact ionization. For this reason, it is convenient to discuss both together on this web page. DMOX derivatives tend to give more abundant diagnostic ions and have better gas chromatography properties, but pyrrolidides give more informative spectra when the functional group is close to either end of the molecule. Most of the spectra illustrated here have not been published elsewhere.
This is intended as a practical guide and the mechanistic aspects are discussed in an over-simplified fashion, though earlier documents in this series, especially those dealing with derivatives of saturated fatty acids, document some basic mechanistic concepts. Mass spectra of methyl esters (in underivatized form or as trimethylsilyl ethers), and 3‑pyridylcarbinol esters are described in separate documents on this website. We have no spectra of eicosanoids or related oxylipins. There is a web page dealing with the occurrence, chemistry and biochemistry of hydroxy acids on this site here...
2- and 3-Hydroxy Fatty Acids
After several attempts, we did not succeed in preparing DMOX derivatives from saturated and monoenoic 2‑hydroxy acids by our usual methods (and we have no explanation for this), although this has now been accomplished by a new mild derivatization procedure in which the reaction is facilitated by the presence of sodium borohydride (Santalova, E.A. and Svetashev, V.I., 2022). On the other hand, pyrrolidide derivatives were easy to prepare from the methyl esters of 2-hydroxy-fatty acids, and they can be recommended for this particular purpose. Tulloch (1985) has described the mass spectra of the pyrrolidides of the complete series of hydroxy-octadecanoates and their TMS ethers. The pyrrolidide of 2-hydroxy hexadecanoate has the distinctive mass spectrum illustrated next -
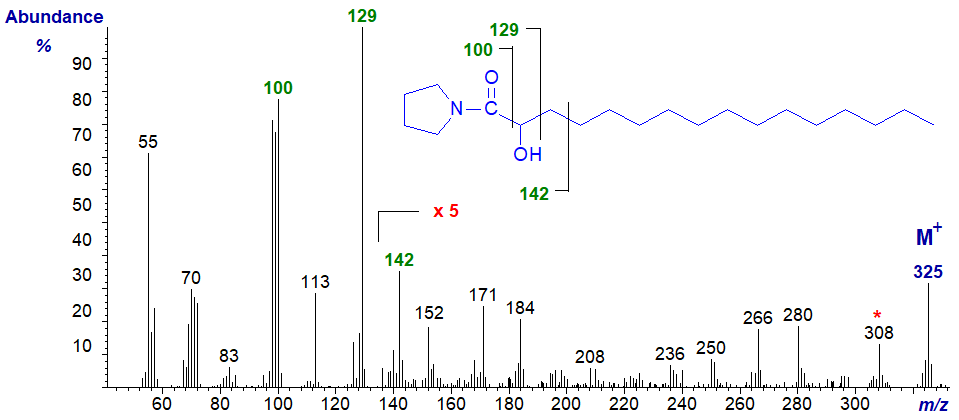
The key ion is the base ion at m/z = 129, which simplistically reflects cleavage between carbons 2 and 3 adjacent to the carbon with the hydroxyl group, i.e., the McLafferty ion, while a characteristic triplet of ions of m/z = 98 to 100 presumably represents cleavage between carbons 1 and 2 with addition of variable numbers of protons. Other useful diagnostic ions are those at m/z = 142, 152, 171 and 184. In the high molecular weight region, the last significant ion before the molecular ion is at m/z = 308, representing a loss of 17 amu for the hydroxyl moiety and not m/z = 310 from loss of the terminal methyl group. Analogous features are present in the spectra of pyrrolidides of saturated 2-hydroxy-fatty acids with 12 to 26 carbon atoms (not illustrated here, but see the Archive pages on this website).
The mass spectrum of the pyrrolidide of 16-methyl-2-hydroxy-heptadecanoate (a constituent of wool wax) -
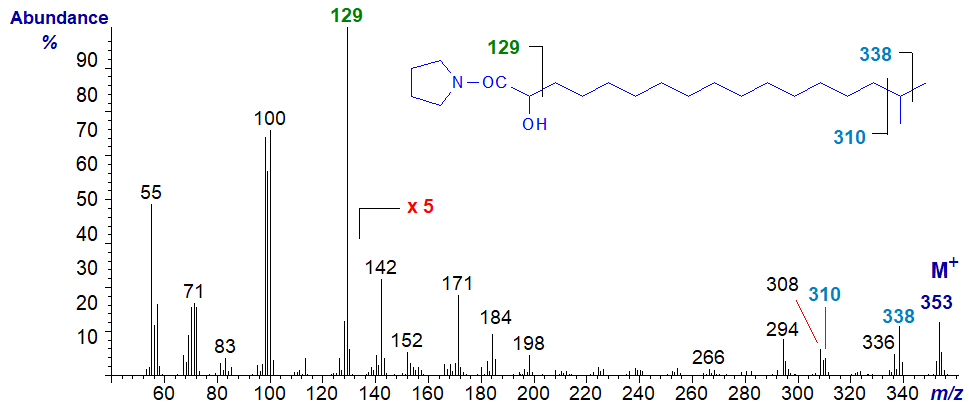
The spectrum differs significantly from the previous (apart from the molecular weight) mainly in that the last significant ion before the molecular ion is at m/z = 338, representing a loss of 15 amu for the terminal methyl group, presumably (rather than a loss of 17 amu - see the ion at m/z = 336). A gap for the loss of the iso-methyl branch is apparent between m/z = 310 and 338.
Although, we failed with the derivatization of saturated 2-hydroxy acids, we were able to prepare the DMOX derivatives of 2-hydroxy-octadeca-9,12,15-trienoate, a minor component of the seed oil of Thymus vulgaris, which gave a particularly distinctive mass spectrum -
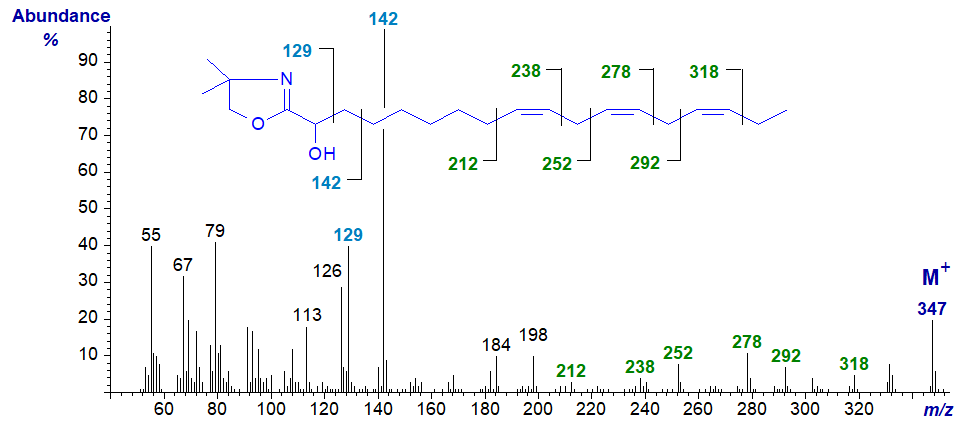
The ion at m/z = 142 locates the hydroxyl group definitively, though beta cleavage, while the double bonds are best located using the approach favoured for 3‑pyridylcarbinol esters, i.e., to look for the gaps of 26 amu for each of the double bonds as illustrated.
In contrast, the pyrrolidide of this fatty acid has the expected alpha cleavage ion at m/z = 129, except that the ions in the high mass range are much less abundant and thus less distinctive; if this were an unknown, the spectrum would not be interpretable in terms of double bond positions. The ion at m/z = 142 is of relatively low abundance in this instance, but the triplet of ions at m/z = 98 to 100 appears to be characteristic (see the spectrum here...).
Once more, after several attempts, we could not prepare either 3-pyridylcarbinol esters or DMOX derivatives from 3-hydroxy acids, although the pyrrolidide derivative is easy to prepare from the methyl ester, and that of 3-hydroxy-tetradecanoate has the distinctive mass spectrum illustrated -
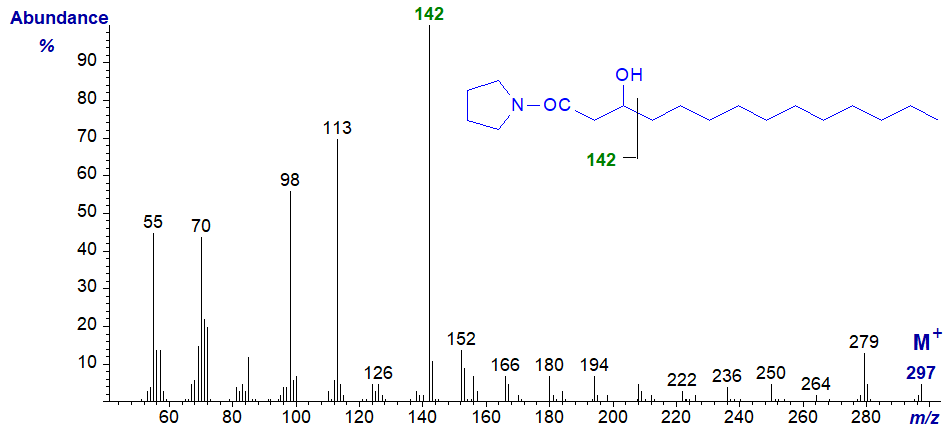
The characteristic ion is that at m/z = 142, representing cleavage between carbon atoms 3 and 4, as shown (Tulloch, 1985), while that at m/z = 98 is also diagnostic and confirmatory. There is no ion at m/z = 129.
Fatty Acids with Centrally Located Hydroxyl Groups
The seed oil of Nerium oleander contains 9-hydroxy-octadec-12-enoic acid and its DMOX derivative has the spectrum -
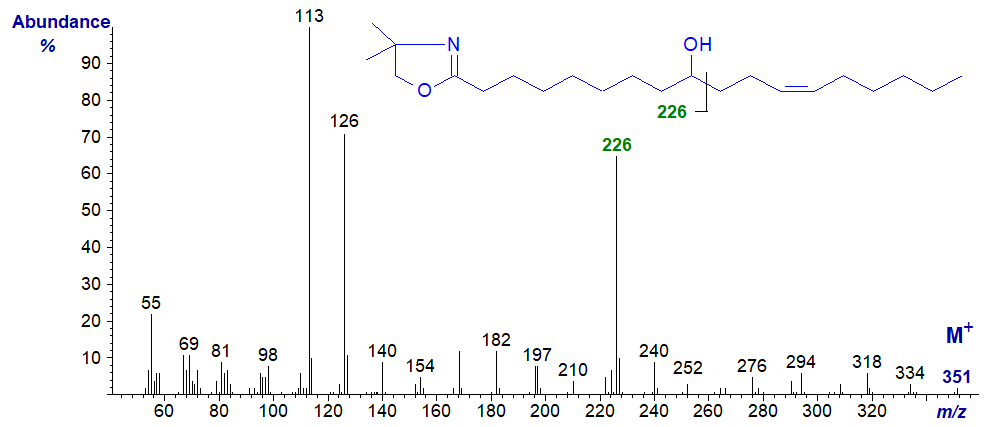
The position of the hydroxyl group is clearly defined from the cleavage ion at m/z = 226, but ions that might serve to locate the double bonds are lost in noise.
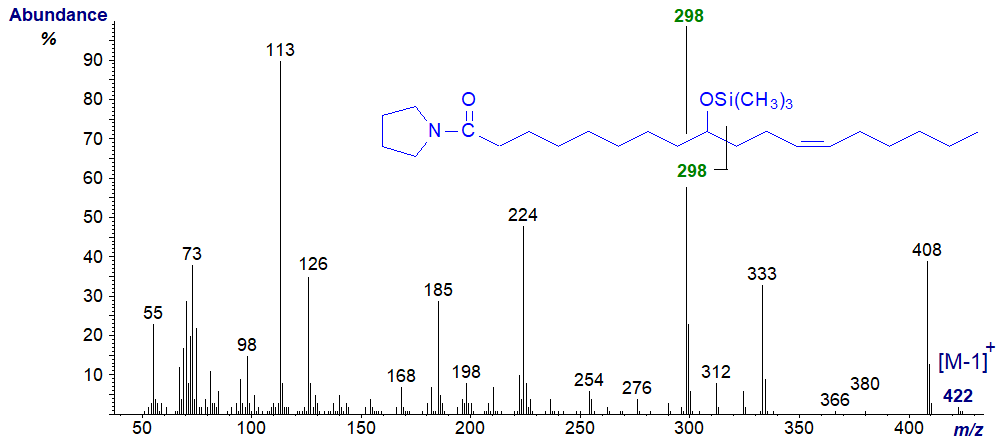
In this instance, the mass spectrum of the pyrrolidide is much less helpful as an unidentified ion at m/z = 224 obscures the picture (illustrated here...). Similarly, preparation of the trimethylsilyl ether derivatives of the DMOX and pyrrolidides, a common procedure that improves chromatographic resolution, did not aid characterization in this case. The expected ion for alpha cleavage at m/z = 298 was the base ion in both instances, but the position of the double bond could not be confirmed. In particular, the spectrum of the pyrrolidide-TMS derivative illustrated contains a number of ions that are not immediately identifiable and may result from transfer of the OTMS moiety to the carboxyl group (e.g. at m/z = 185 and 224), as discussed in relation to the spectra of the analogous methyl esters. The ion at m/z = 333 presumably reflects the loss of a trimethylsilyloxy ion. These are not seen with the corresponding DMOX derivative.
The other common hydroxy-monoene is ricinoleic acid or 12-hydroxy-octadec-9-enoic from castor oil. The spectrum of the DMOX derivative of ricinoleate -
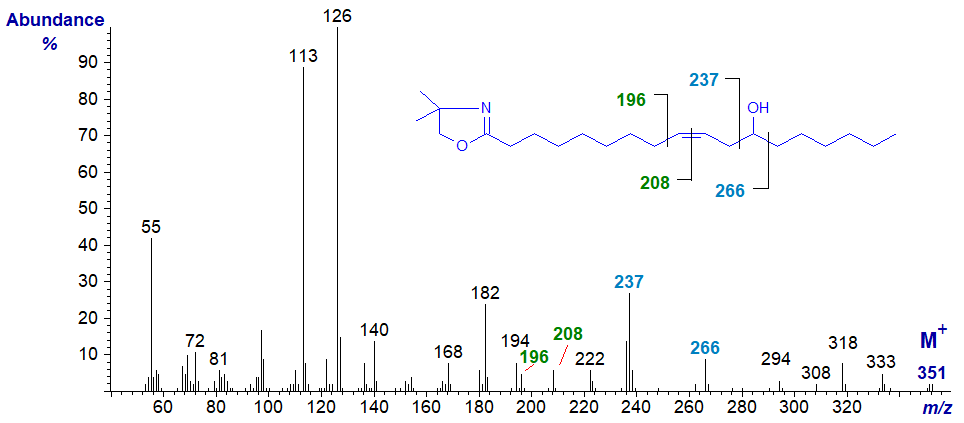
In this instance, the double bond is recognized as in other monoenes by the gap of 12 amu between m/z = 196 and 208. The fragments at m/z = 237 (presumably protonated and unusual in being odd-numbered) and at 266 are formed by cleavage alpha to the carbon carrying the oxygen atom (Zhang et al., 1988). The mass spectrum of the pyrrolidide derivative is very similar to this - here....
The trimethylsilyl ether of the DMOX derivative of ricinoleate has a simple but much less interesting spectrum that again provided no further useful information -
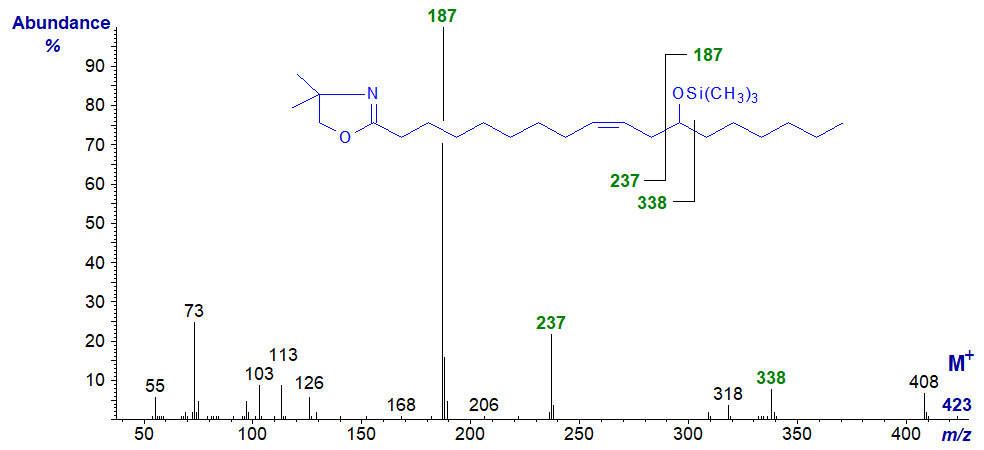
There are fragments that clearly locate the hydroxyl group, as illustrated, but none that fix the position of the double bond.
The TMS ether of the pyrrolidide derivative has a more complex though no more informative spectrum (see here for an illustration). There are analogous ions in the spectra of the same derivatives of 14-hydroxy-eicos-11-enoate.
15-Hydroxy-octadeca-9,12-dienoic acid (15-hydroxy-linoleate or 'avenoleate') is found in the monogalactosyldiacylglycerol fraction of oat seed lipids. The mass spectrum of the DMOX derivative of 15-hydroxy-linoleate -
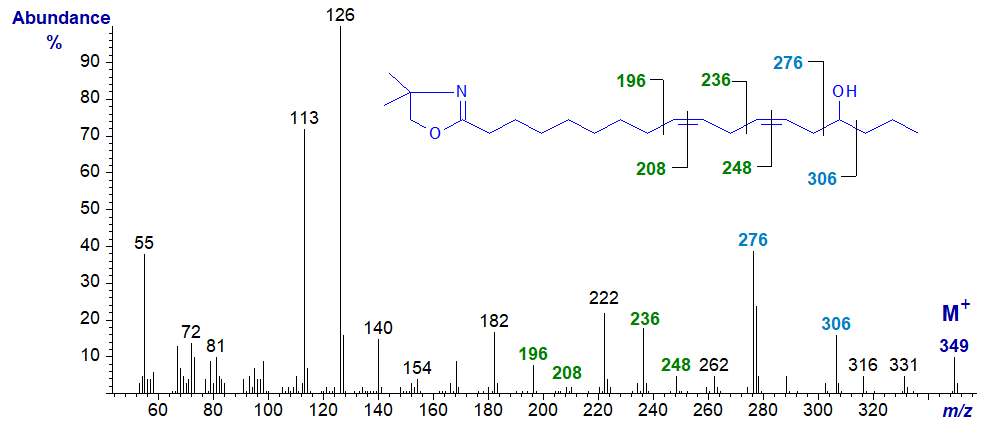
Again, the molecular ion is obvious (m/z = 349), and there are ions diagnostic for the position of both the hydroxyl group and the double bonds. Thus, ions at m/z = 276 and 306 reflect cleavage on either side of the carbon linked to the hydroxyl group, while the gaps of 12 amu between m/z = 196 and 208, and 236 and 248, serve to locate the double bonds in positions 9 and 12, respectively (see the web page on DMOX derivatives of dienoic fatty acids).
The spectrum of the trimethylsilyl ether derivative of the latter has a distinctive feature like that of the methyl ester in that the base ion is at m/z = 145, which represents cleavage between carbons 14 and 15 and is the terminal part of the molecule (very unusual for a DMOX derivative); the other fragment is at m/z = 277, but the ions expected for the double bonds are not easily seen, however.

(ω-1)- and ω-Hydroxy Fatty Acids
Fatty acids with hydroxyl groups on the terminal (omega) or omega-1 carbons are common constituents of waxes and plant cutins, the source of the spectra that follow. The mass spectrum for the pyrrolidide of 15-hydroxy-hexadecanoate -

Interpretation of the spectrum is made more difficult by the presence of ions simply reflecting a loss of water, but ions at m/z = 281 and 310 serve to locate the hydroxyl group.
The spectrum of the TMS ether of the pyrrolidide is relatively simple and informative. Ions at m/z = 281, 117 and 382 are diagnostic in this instance (cf., Tulloch, 1985).

The pyrrolidide of 16-hydroxy-hexadecanoate -

Again, the main diagnostic ion is that for the loss of the terminal carbon and its hydroxyl group (cf., Tulloch, 1985), but the spectrum of the DMOX derivative of 16‑hydroxy-hexadecanoate is of relatively little value in terms of structural features, as ions from loss of methyl groups from the oxazoline ring confound the spectrum.

That said, the mass spectrum of an authentic sample is always useful if only as a fingerprint for comparison purposes, and there are more spectra of hydroxy fatty acids available in our DMOX archive and Pyrrolidide archive.
References
- Santalova, E.A. and Svetashev, V.I. Preparation of 4,4-dimethyloxazoline and pyrrolidine derivatives from fatty acid methyl esters using sodium borohydride: mild and simple one-pot derivatization procedures for a gas chromatographic-mass spectrometric analysis of fatty acids. Nat. Prod. Res., 17, 1934578X221131408 (2022); DOI.
- Tulloch, A.P. Mass spectrometry of pyrrolidides of oxo, hydroxy and trimethylsilyloxy octadecanoic acids. Lipids, 20, 652-663 (1985); DOI.
- Zhang, J.Y., Yu, Q.T., Yang, Y.M. and Huang, Z.H. Chemical modification in mass spectrometry. 11. Mass spectra of 4,4-dimethyloxazoline derivatives of hydroxy fatty acids. Chem. Scripta, 28, 357-363 (1988); DOI.
I can recommend - Christie, W.W. and Han, X. Lipid Analysis - Isolation, Separation, Identification and Lipidomic Analysis (4th edition), 446 pages (Oily Press, Woodhead Publishing and now Elsevier) (2010) - at Science Direct.
| © Author: William W. Christie |  |
|
| Updated: May 2025 | Contact/credits/disclaimer | |
© The LipidWeb is open access and fair use is encouraged but not text and data mining, AI training, and similar technologies.
