Mass Spectrometry of Methyl Esters
Hydroxy Fatty Acids (not further derivatized)
 In this document,
mass spectra (electron-impact ionization) of methyl esters of hydroxy fatty acids are arranged and discussed according
to the positions of hydroxyl groups in the alkyl chains, regardless of degree of unsaturation.
Spectra of methyl esters and lactones in which the hydroxyl group is esterified internally are both discussed here.
Trimethylsilyl ether derivatives (methyl esters),
3-pyridylcarbinol ('picolinyl') esters
and DMOX derivatives together with pyrrolidides
are described in separate documents (when available),
but none of these has unique advantages, and there are too many gaps in this account to discuss which is best in any systematic way.
Methyl ester derivatives are perfectly satisfactory for saturated fatty acids at least
(the definitive paper is by Ryhage and Stenhagen, 1960).
Preparation of the trimethylsilyl (TMS) ether derivatives of the hydroxyl groups can be helpful both in terms of improved chromatographic
resolution and interpretation of mass spectra, (see Nicolaides et al., 1983)
and this is the subject of Part 2.
Pyrrolidides are a good alternative choice for 2- and 3-hydroxy isomers, especially.
There is a web page dealing with the occurrence, chemistry and biochemistry
of hydroxy fatty acids on this site here...
The choice of spectra in this section may appear rather eccentric, but as with my other documents on mass spectrometry, this is a subjective account that details only those hydroxy fatty acids encountered during our research activities here and for which we have spectra available for illustration purposes. I trust that we have a sufficiently wide range of spectra to give the flavour of the subject. My colleagues and I have never worked with oxylipins, so no spectra of such compounds can be discussed here, although they are obviously relevant to this topic. Many of the following spectra have not been published elsewhere, but I cite references to previous publications when they are known to me.
A common feature of mass spectra of hydroxy acids is fragmentation leading to the loss of the elements of water to produce ions corresponding to [M-17]+ or [M‑18]+. This is not a mechanistic treatise, so my interpretations are intended as a practical guide, and they are intentionally over-simplified.
2- and 3-Hydroxy Fatty Acids
2-Hydroxy long-chain saturated fatty acids occur frequently in sphingolipids of plant and animal origin, and they are often found in waxes. The mass spectrum of methyl 2‑hydroxy-hexadecanoate is -
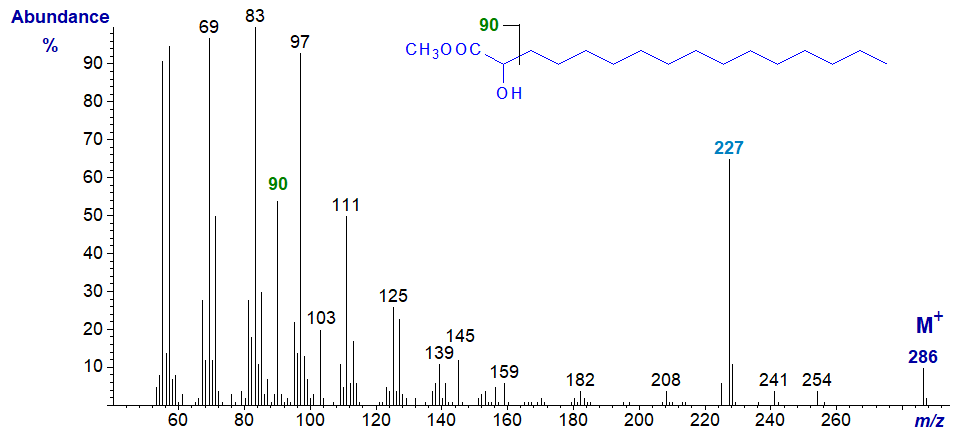
The ion at m/z = 90 may be the McLafferty rearrangement ion (simplistically illustrated here as cleavage between C2 and C3, but see our web page on mass spectra of methyl esters of saturated fatty acids for a proper explanation), and that at m/z = 227 ([M‑59]+) may represent expulsion of the three-carbon fragment comprising C2 to C4 (Ryhage and Stenhagen, 1960). The molecular ion can be much smaller as the chain length diminishes. Ions corresponding to [M‑18]+ tend to be very small to non-detectable with the saturated homologues.
Monoenoic 2-hydroxy very-long-chain fatty acids are also found in sphingolipids, and as an example the mass spectrum of methyl 2‑hydroxy-tetracos-15-enoate is -
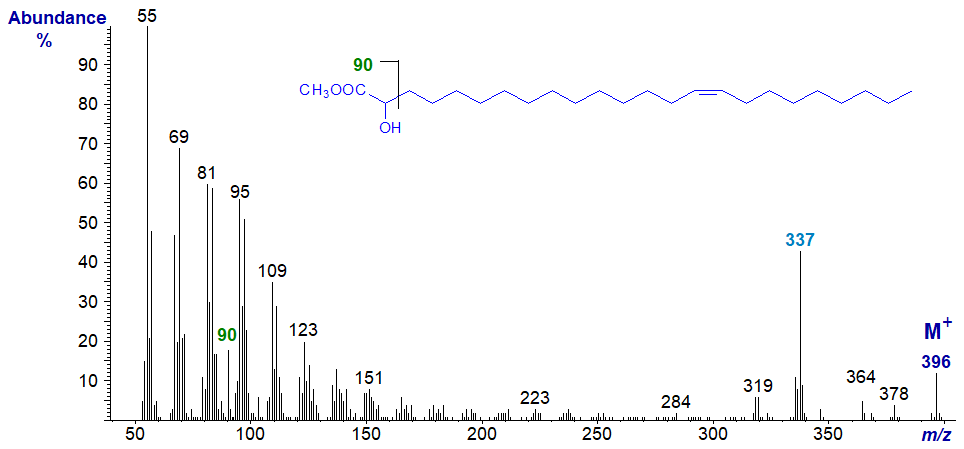
The spectrum is not very different from that of the corresponding saturated fatty acid, and the presence and location of the 2-hydroxyl group is again recognized by the ion at m/z = 90, while the ion representing [M‑59]+ is prominent. As expected, there is nothing to indicate the position of the double bond. Analogous features are present in the spectra of methyl esters of saturated or monoenoic 2‑hydroxy-fatty acids with 10 to 27 carbon atoms (see the Archive section of this website). There is an [M‑18]+ ion in this instance at m/z = 378.
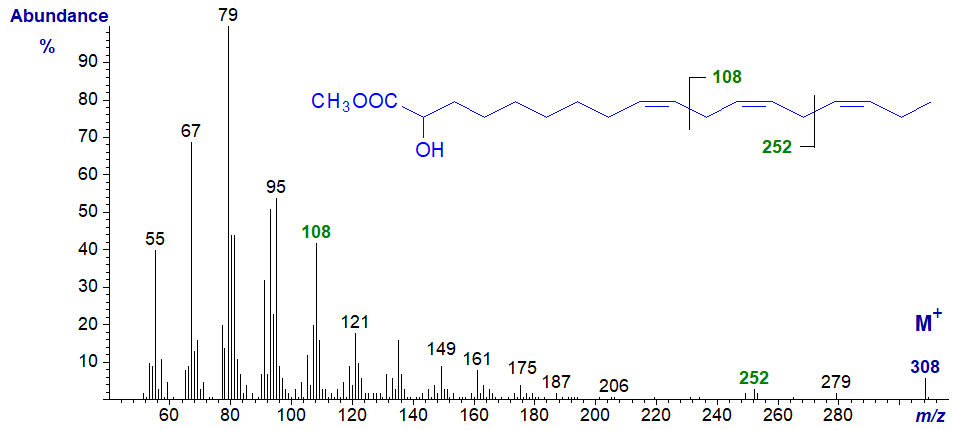
2-Hydroxy-octadeca-9,12,15-trienoic acid is a minor component of the seed oil of Thymus vulgaris, but the spectrum of its methyl ester is not very informative in terms of the position of the hydroxyl group in that it lacks the ion at m/z = 90 found with saturated and monoenoic analogues. The double bond positions are indicated by the ion at m/z = 108 (ω-ion), which is a reminder that it is an (n-3) fatty acid, while the ion at m/z = 252 is the corresponding α-ion (see the web page on mass spectra of methyl esters of trienes for a detailed explanation for these ions).
3-Hydroxy acids are found in certain microbial lipids (rhamnolipids, lipopolysaccharides and lipid A), avian waxes and occasionally in animal tissues, sometimes as by-products of β-oxidation. The mass spectrum of methyl 3-hydroxy-tetradecanoate (from a commercial standard) is -
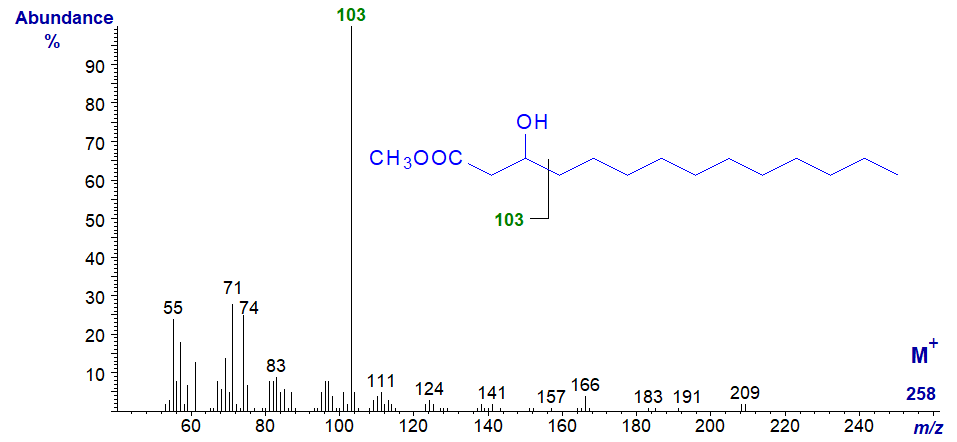
The molecular ion (m/z = 258) can only be seen by magnifying the appropriate part of the spectrum, and identification of homologues can be difficult without access to authentic spectra, but the base ion at m/z = 103 is produced by a characteristic cleavage alpha to the carbon with the hydroxyl group and defines its position (Ryhage and Stenhagen, 1960).
We have not been able to prepare 3‑pyridylcarbinol ester or DMOX derivatives of the common 2- or 3-hydroxy acids for comparison purposes (for which we have no explanation), but the reaction to produce pyrrolidides presented no problems.
4- and 5-Hydroxy Fatty Acids
4- and 5-Hydroxy acids tend to form lactones spontaneously, i.e., γ- and δ-lactones, respectively, and they are most often encountered in this form. They are important flavour components of dairy products.
The δ-lactone from 5-hydroxy-tetradecanoate, present in cow's milk, has the mass spectrum (1) -
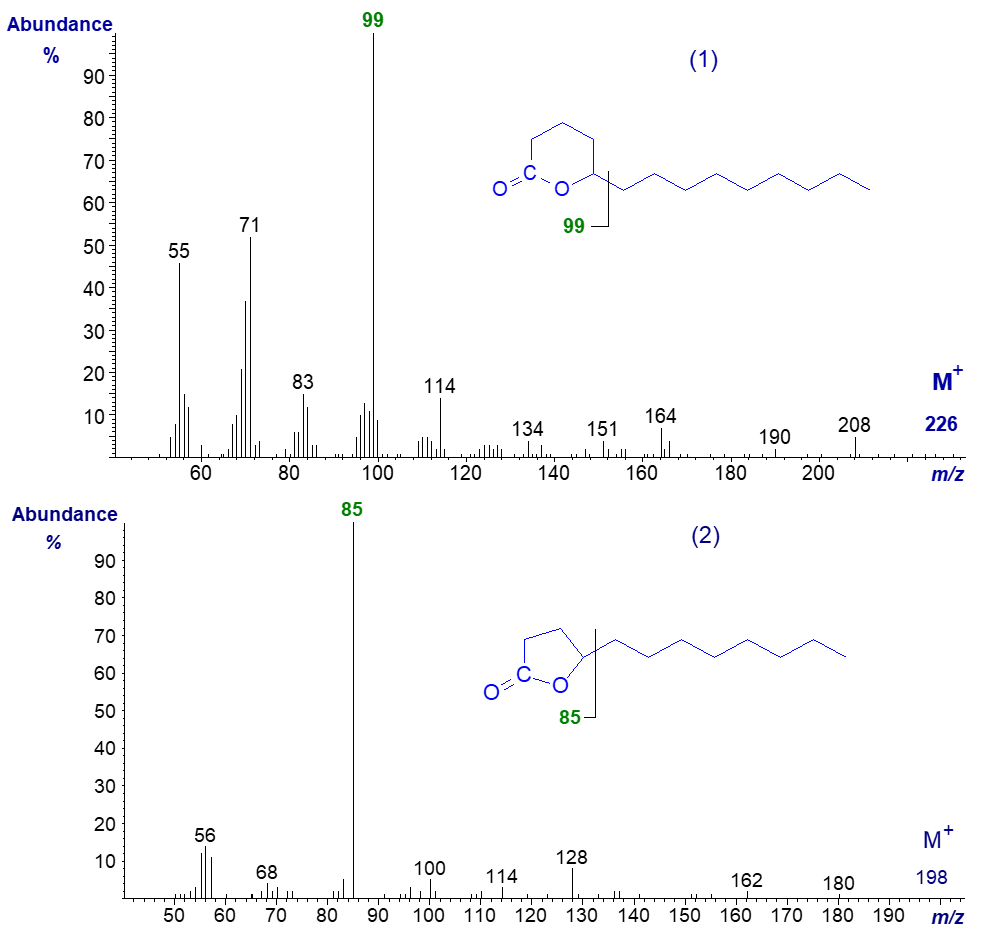
The molecular ion is not discernible, but there is a distinctive fragmentation at the lactone ring (the base ion) at m/z = 99. The first significant ion in the high mass range is at m/z = 208, for loss of the elements of water. With higher homologues, a significant molecular ion is obtained and ions in the high mass range are more prominent. In the spectrum of a γ-lactone (2), presumably derived from a 4‑hydroxy-dodecanoic acid (also from milk fat but much less abundant), the base ion is at m/z = 85. There are spectra of more delta- and gamma-lactone homologues in our Archive page.
6- to 10-Hydroxy Fatty Acids
When the hydroxy group is in a more central part of the molecule, the main fragmentation is still beta to the oxygen atom or alpha to the carbon to which it is linked, although an ion that reflects further fragmentation by the loss of the elements of methanol (32 amu less) may be even more abundant. The molecular ion is not easily detected, and ions equivalent to [M‑31]+ or [M‑17]+, especially the former, must be used to determine the molecular weight. Thus, in the spectrum of methyl 6‑hydroxy-tetradecanoate (a minor component of milk fat) -
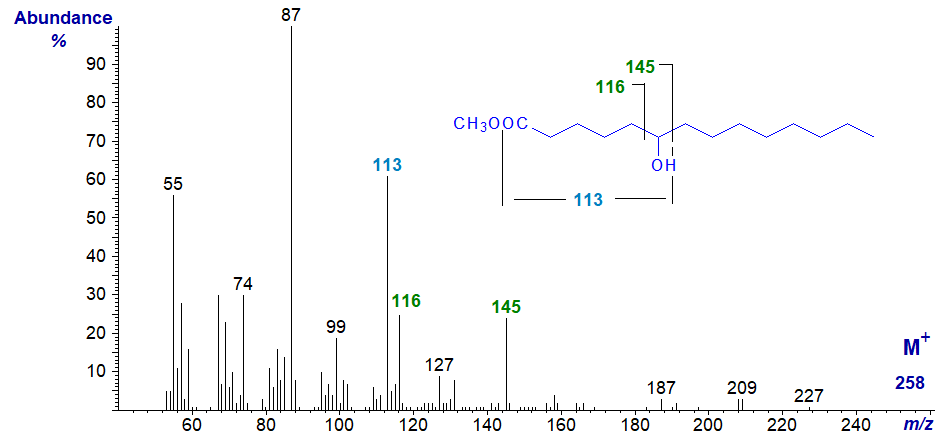
- the key fragmentation ion is at m/z = 145, while that at m/z = 113 is formed from this by further fragmentation with loss of the elements of methanol as illustrated, together with the ion at m/z = 116 in the same manner from a fragmentation on the other side.
8-Hydroxy-hexadecanoic acid is a minor component of bovine milk fat and its methyl ester exhibits similar features to the previous, except that the key diagnostic ions are shifted upwards by 28 amu as expected.
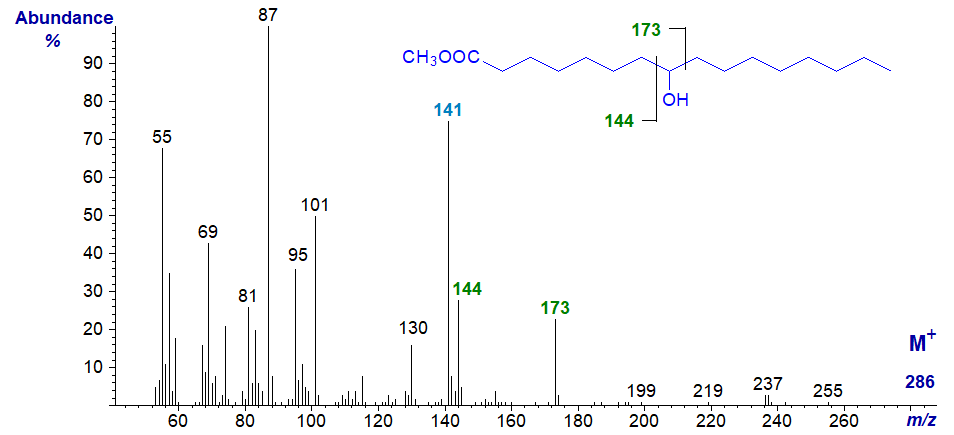
Thus, the key ion for interpretative purposes is at m/z = 173, while that at m/z = 141 is formed from this by further fragmentation with the loss of methanol. The ion at m/z = 144 results from a comparable cleavage but alpha to the carbon carrying the hydroxyl group on the carboxyl side.
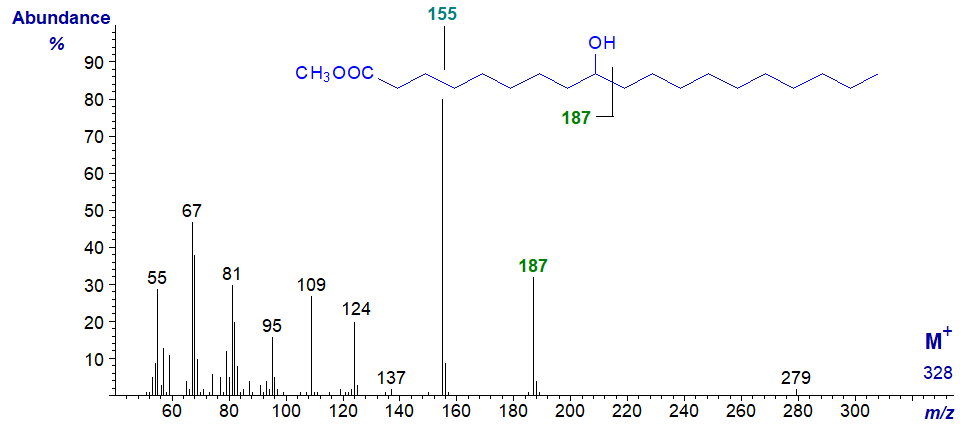
9-Hydroxy-nonadecanoic acid is a minor component of cow's milk fat and its methyl ester exhibits similar features to the previous, except that the key diagnostic ions are now at m/z = 187 and at 155 (the base ion), the latter representing loss of methanol from the former. An ion for cleavage on the other side of the hydroxyl group, anticipated at m/z = 158, was not detected in this instance.
9-Hydroxy-octadec-12-enoic acid is a constituent of the seed oil of Nerium oleander. The spectrum of the methyl ester (not published elsewhere) is very different from that of the saturated analogue, but it has the diagnostic ions at m/z = 187 and 155 expected from the previous spectrum. The molecular ion is insignificant, and the ion representing [M‑18]+ is necessary to confirm the molecular weight. Otherwise, it is not very informative, and as might be expected, there are no obvious ions that serve to locate the double bond. The mass spectrum of the methyl ester after conversion to the trimethylsilyl ether derivative has been published by Kleiman and Spencer (1973).
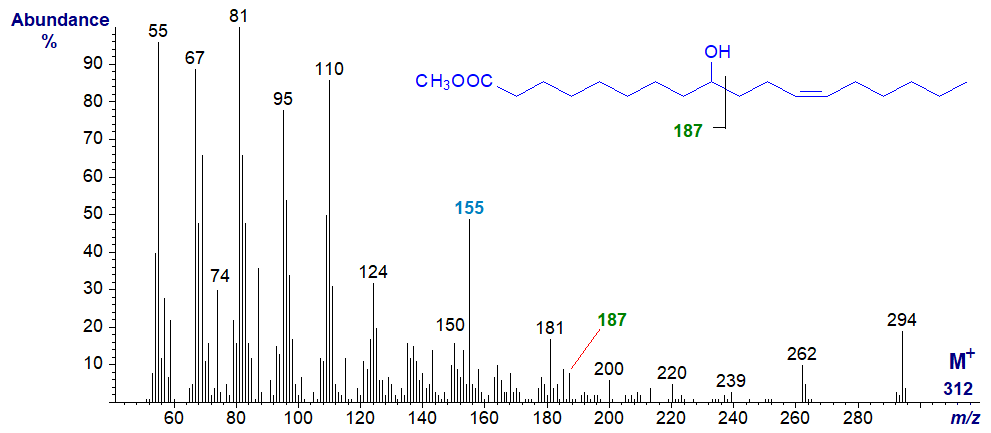
The mass spectrum of methyl dimorphecolate (9-hydroxy-octadec-trans-10,cis-12-dienoate) is not too different from this (see the Archive section), although there are additional rearrangement ions involving carbons 1 to 9.
10-Hydroxy-octadecanoic acid is produced by several microorganisms, and is a further minor component of cow's milk fat, which was the origin of the spectrum illustrated here, i.e., methyl 10-hydroxy-octadecanoate has the spectrum -

In common with the other hydroxy acids discussed here, the molecular ion is virtually absent. The main fragmentations occur alpha to the carbon carrying the hydroxyl group on the side remote from the carboxyl group, with a further rearrangement leading to the loss of the elements of methanol, as illustrated. Ryhage and Stenhagen (1960) illustrated this spectrum and show a significant ion at m/z = 172 for cleavage between carbons 9 and 10, which we do not see.
12- to 15-Hydroxy Fatty Acids
The mass spectrum of methyl 12-hydroxystearate, which was produced by hydrogenation of ricinoleate for use as a standard is -

Cleavage occurs beta to the oxygen atoms to give the ions at m/z = 229 and 200/199 together with the base ion at m/z = 197 formed from this by loss of the elements of methanol (32 amu). Ions formed by fragmentation on the other side of the hydroxyl group at m/z = 115 and 200, as illustrated on the spectrum, are now relatively abundant.
12-Hydroxy-octadec-9-enoic (ricinoleic acid) is the main component of castor oil (Ricinus communis), which is a major agricultural and industrial product. The mass spectrum of methyl ricinoleate, which follows, is distinctive, although the molecular ion is not seen, and the only significant ion in the high mass region is for loss of water at m/z = 294. The ion at m/z = 198 probably represents cleavage between carbons 11 and 12, and that at m/z = 166 a further loss of methanol from the carboxyl group. Presumably, the presence of the double bond influences this fragmentation, as the expected ions from cleavage between carbons 12 and 13 at m/z = 227 and 195 are rather small. The distinctive ion at m/z = 124 is formed from the carboxyl end of the molecule, but any further suggestion would be speculative.

We have the spectrum of methyl 14-hydroxy-eicos-11-enoate (lesquerolic acid), the C20 analogue of ricinoleic acid, but illustrated in our Archive pages. It supports the above assignations in that all the relevant diagnostic ions are now 28 amu higher.
15-Hydroxy-octadeca-9,12-dienoic acid (15-hydroxy-linoleate or 'avenoleate') is found in the monogalactosyldiacylglycerol fraction of oat seed lipids (Hamberg and Hamberg, 1996). In nature, the hydroxyl group is esterified with a further molecule of linoleate, i.e., it is an estolide. The methyl ester of 15‑hydroxy-linoleate has the spectrum illustrated next -

Again the molecular ion is not apparent, but the ion at m/z = 238 for cleavage between carbons 13 and 14 (containing the carboxyl group) is diagnostic, together with an ion for further loss of the elements of methanol (m/z = 206).
(ω-1)- and ω-Hydroxy Fatty Acids
In animal tissues, a family of enzymes termed cytochromes P450s are involved in fatty acid oxidation, hydroxylating with high specificity at the energetically unfavourable terminal (omega) or omega-1 carbons. Such fatty acids are common constituents of waxes and plant cutins.
Methyl 15-hydroxy-hexadecanoate (an omega-1 hydroxy fatty acid from beeswax) -

The ion at m/z = 242 can be considered simplistically as representing cleavage as illustrated alpha to the carbon carrying the hydroxyl group, and it serves to locate this (Ryhage and Stenhagen, 1960). Other than the insignificant molecular ion, the spectrum bears some resemblance to that of the methyl ester of a conventional saturated fatty acid.
Methyl 16-hydroxy-hexadecanoate (a commercial standard) -

With methyl esters of saturated ω-hydroxy acids, the most significant ion in the high mass range represents a loss of 30 amu (not 31 or 32), at m/z = 256 in this instance, presumably reflecting cleavage of the terminal -CH2OH group. This is the most useful diagnostic ion, and a comparable ion is present in the spectrum of methyl 9-hydroxy-nonanoate.
On the other hand, the spectrum is somewhat different when there is a double bond in the chain, as in that of methyl 18-hydroxy-octadec-9-enoate -

In this example, there is a small but significant molecular ion at m/z = 312, followed by an ion at m/z = 294 representing the loss of water. There is a gap of 32 amu from the molecular ion to m/z = 280 for the loss of the elements of methanol, followed by a gap of 18 to m/z = 262 for the loss of water from the latter ion.
The spectra discussed above are representative of a large number of isomers and homologues of methyl esters of hydroxy acids, available for consultation without interpretation in our Archive pages.
Part 2 of this topic deals with mass spectra of methyl esters of hydroxy acids after conversion to the trimethylsilyl ether derivatives.
References
- Hamberg, M. and Hamberg, G. 15(R)-Hydroxylinoleic acid, an oxylipin from oat seeds. Phytochemistry, 42, 729-732 (1996); DOI.
- Kleiman, R. and Spencer, G.F. Gas chromatography-mass spectrometry of methyl esters of unsaturated oxygenated fatty acids. J. Am. Oil Chem. Soc., 50, 31-38 (1973); DOI.
- Nicolaides, N., Soukup, V.G. and Ruth, E.C. Mass spectrometry fragmentation patterns of the acetoxy and trimethylsilyl derivatives of all the positional isomers of the methyl hydroxypalmitates. Biomed. Mass Spectrom., 10, 441-449 (1983); DOI.
- Ryhage, R. and Stenhagen, E. Mass spectrometric studies. VI. Methyl esters of normal chain oxo-, hydroxy-, methoxy- and epoxy-acids. Arkiv Kemi, 15, 545-574 (1960).
- Tulloch, A.P. Mass spectrometry of pyrrolidides of oxo, hydroxy and trimethylsilyloxy octadecanoic acids. Lipids, 20, 652-663 (1985); DOI.
I can recommend - Christie, W.W. and Han, X. Lipid Analysis - Isolation, Separation, Identification and Lipidomic Analysis (4th edition), 446 pages (Oily Press, Woodhead Publishing and now Elsevier) (2010) - from Science Direct.
| © Author: William W. Christie |  |
|
| Updated: June 2025 | Contact/credits/disclaimer | |
© The LipidWeb is open access and fair use is encouraged but not text and data mining, AI training, and similar technologies.
