Mass Spectrometry of some Miscellaneous Lipids
 During the
analysis of natural fatty acid samples, various less common lipids may be encountered.
They may be present naturally in the samples or they can be formed as artefacts, or indeed by mistake
if a derivatization reaction is carried out incorrectly.
For example, sterols can interfere in GC traces if not removed from samples of fatty acid esters,
and it can be helpful to have a spectrum of cholesterol available as a check.
Of course, mass spectrometric analysis of sterols per se is an important task, but it is outwith my general research interests,
and I lack the expertise to discuss such spectra in detail.
As this is intended as a practical guide only, I show mass spectrometric fragmentations in an overly simplified manner.
Amongst many natural lipids, mass spectra of the following − dimethyl acetals − amides and amines − cholesterol − hydrocarbons − have cropped up during our research activities. Most of these spectra with electron-impact ionization are offered for comparison or record purposes, and I have added cursory descriptions only. I presume that many of the following spectra will have been published elsewhere, but I have not attempted to check this to establish priority. You may find some further relevant information in our web page on artefacts and additives.
Dimethylacetals of Aliphatic Aldehydes
When the plasmalogen forms of phospholipids, common in animal tissues and in some microorganisms (but not plants), are treated with acidic transesterification reagents when preparing methyl esters, the vinyl ether bond is broken and aldehydes are generated, which are immediately converted to dimethyl acetals. These are almost exclusively saturated and monounsaturated (C16 and C18 in chain length), and they tend to elute just before 16:0 and 18:0 methyl esters, respectively, on most GC phases. The mass spectra of the three common isomers follow; they are uninteresting but distinctive.
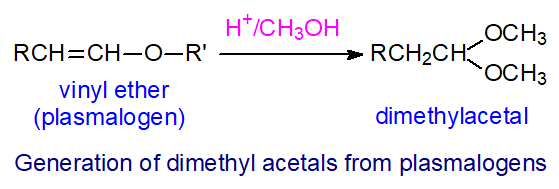 |
| Figure 1. Generation of an dimethyl acetal from a plasmalogen. |
First the dimethyl acetal of hexadecan-1-al -
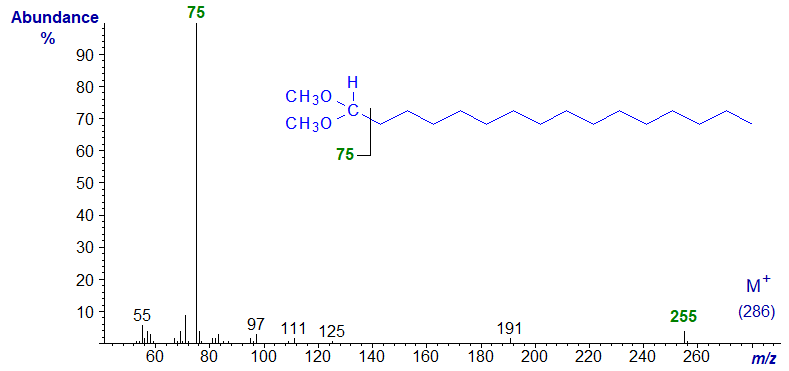
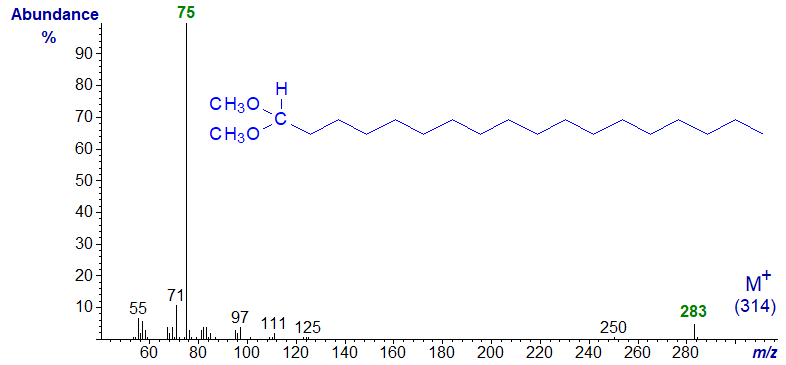
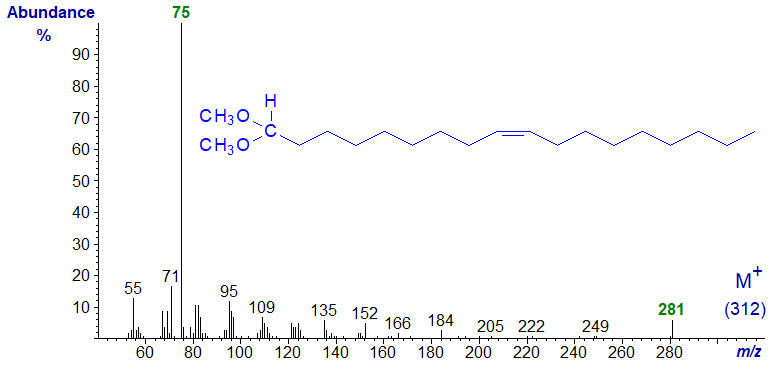
The base peak is the McLafferty rearrangement ion at m/z = 75, but the molecular ion can only be seen if this region of the spectrum is greatly magnified relative to the base ion. The first significant ion in the high mass range, at m/z = 255, represents the loss of a methoxyl ion, and in practice this ion must be used to find the molecular weight. The remaining spectra are very similar to this, so no further comment seems necessary.
Mass spectrum of the dimethylacetal of octadecan-1-al -
Mass spectrum of the dimethylacetal of octadec-9-en-1-al -
Amides and Amines
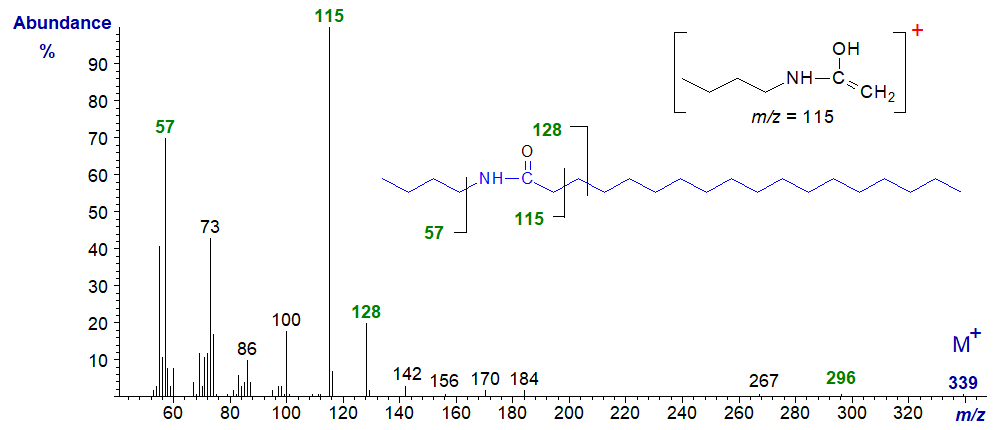
The McLafferty ion at m/z = 115 is the most abundant ion in the mass spectrum of simple amides of saturated fatty acids, such as N‑butyl-octadecamide illustrated next. The mechanism for the formation of this important ion is discussed in greater detail in our web pages on mass spectra of methyl ester derivatives of saturated fatty acids. The ion for loss of 43 amu at m/z = 296 is formed by expulsion of a fragment consisting of C2 to C4 from the fatty acid component.
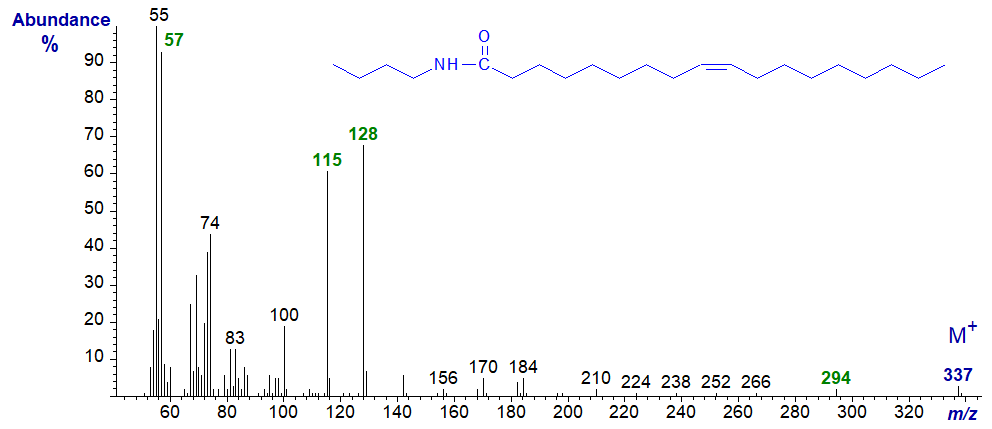
The spectra of unsaturated acyl-amides are similar, differing primarily in the intensity of the diagnostic ions, and that at m/z = 128 increases substantially, while the McLafferty ion at m/z = 115 diminishes. To illustrate this, the mass spectrum of N-butyl-oleamide is -
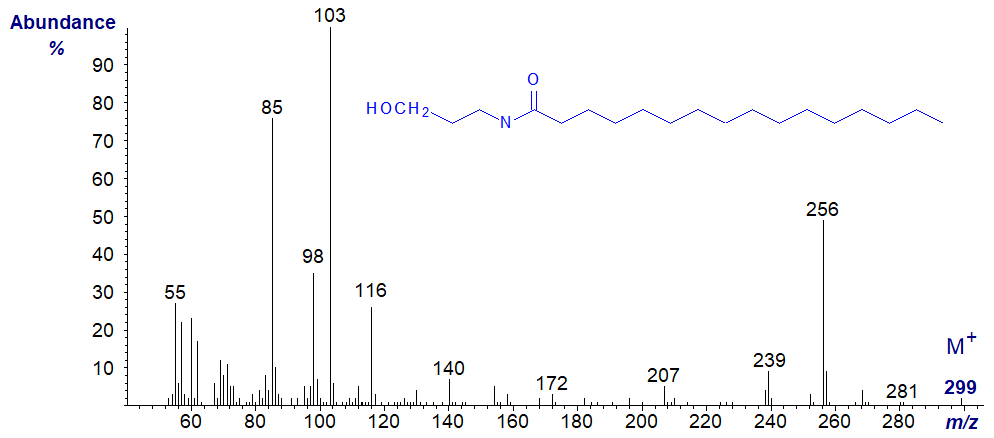
N-Palmitoylethanolamine is a lipid mediator known to alleviate neurological pain. Any attempt to interpret the spectrum would be entirely speculative without further evidence, so I reproduce it here simply as a record.
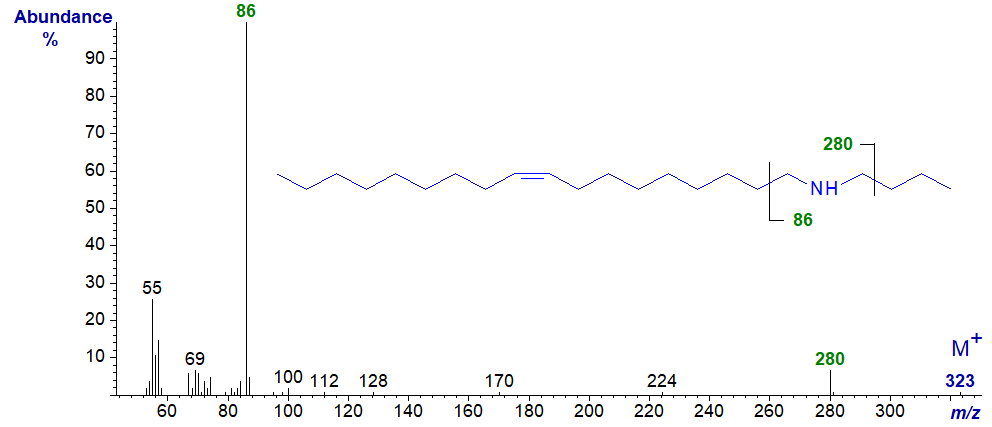
There are few significant differences in the mass spectra of the saturated and unsaturated amines, which we have available for study. Those of secondary amines, such as that of N,N-octadec-9-enylbutylamine illustrated, have simple characteristic fragmentations beta to the nitrogen atom.
Spectra of several more simple amides and amines are available in our Archive pages without discussion (kindly supplied by Isabel Molina (Algoma University, Sault Ste Marie, ON, Canada) and Mike Pollard and John Ohlrogge (Michigan State University, East Lansing, MI, USA).
Cholesterol
Cholesterol is by far the most abundant sterol in animal tissues. It tends to elute from GC columns long after the methyl ester derivatives of most fatty acids, but it does elute eventually as a broad hump in chromatograms to disrupt subsequent analyses of the latter. In practice, it is best eliminated by adsorption chromatography before methyl esters or other derivatives are analysed by GC. Of course, many lipid analysts will require to analyse mass spectra of sterols for their own sake, but I must leave detailed interpretation of the mass spectra of cholesterol and derivatives to sterol specialists as I do not feel qualified to undertake this task. The two following spectra are offered here simply as fingerprints for record purposes. Sterols per se are best analysed separately on non-polar phases either in the free form or better as the trimethylsilyl ethers.
The mass spectrum of free cholesterol -
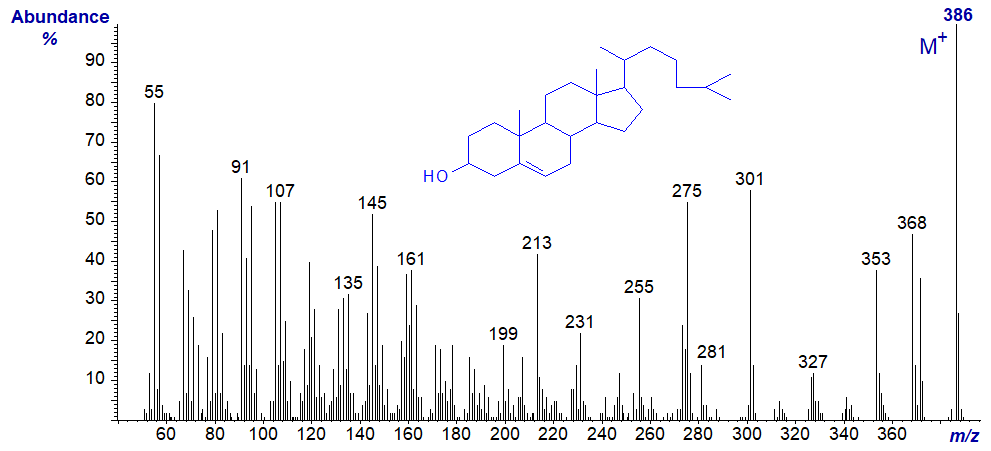
- and that of its trimethylsilyl ether derivative -

There are many more spectra of sterols from animal tissues, plants and yeasts in our Archive pages both in underivatized and trimethylsilylated form, again without interpretation. Regretfully, I have found it a highly tedious and often fruitless task to attempt to identify the less common sterols of animal and plant origin from their mass spectra without access to most commercial libraries of mass spectra. My hope is that someone will one day create a website like this for mass spectrometry of sterols. The following publication on plant sterols may be helpful (Schlag, S., Huang, Y.I. and Vetter, W. GC/EI-MS method for the determination of phytosterols in vegetable oils. Anal. Bioanal. Chem., 414, 1061-1071 (2022); DOI).
Squalene and Other Hydrocarbons
The hydrocarbon squalene tends to be a very minor component of animal tissues, where it is the biosynthetic precursor of sterols, but it can be a major constituent of fats and oils of marine origin on occasion, such as shark oils. Its mass spectrum follows, but no attempt is made at detailed interpretation.

Other hydrocarbons are found among the constituents of natural plant and insect waxes, and the mass spectrum of the fully saturated nonacosane (29:0) from a plant wax follows as an example.

The molecular ion is just discernible, and as might be expected, the spectrum is dominated by ions of the form [(CH2)n+1]+.
While that of the monounsaturated octadec-9-ene is -

In this instance, the spectrum is dominated by ions of the form [(CH2)n−1]+. Many more spectra of hydrocarbons are available in our Archive page.
For further information see - Christie, W.W. and Han, X. Lipid Analysis - Isolation, Separation, Identification and Lipidomic Analysis (4th edition), 446 pages (Oily Press, Woodhead Publishing and now Elsevier) (2010) - at Science Direct.
| © Author: William W. Christie |  |
|
| Updated: June 2025 | Contact/credits/disclaimer | |
© The LipidWeb is open access and fair use is encouraged but not text and data mining, AI training, and similar technologies.
