Mass Spectrometry of Unesterified Fatty acids and their Trimethylsilyl Esters
Lipid analysts tend to have favourite derivatives for the separation and structural analysis of fatty acids by gas chromatography-mass spectrometry, and these are discussed in most of the other web pages on this site. During metabolomics studies especially, free (unesterified) fatty acids may be encountered, or lipid extracts may be trimethylsilylated so that trimethylsilyl (TMS) esters of fatty acids are formed. The electron-impact mass spectra of these are the subject of this web document. As this is intended as a practical guide only, I show mass spectrometric fragmentations in an overly simplified manner. I presume that many of the following spectra will have been published elsewhere, but I have not attempted to check this or establish priority.
Free (Unesterified) Fatty Acids
Unesterified fatty acids are rarely analysed as such by gas chromatography-mass spectrometry, but this is occasionally necessary. Non-polar GC phases are preferable in the chromatography step, as free acids can interact with polyester phases, especially in prolonged use. While free acids have characteristic mass spectra, most of the features can be compared with those of the analogous methyl esters, and in that section of this website, there is more information on mechanistic aspects. The following are illustrated as representative spectra with brief comments only on interpretation.
Mass spectra of saturated fatty acids are relatively simple and that of palmitic acid is -
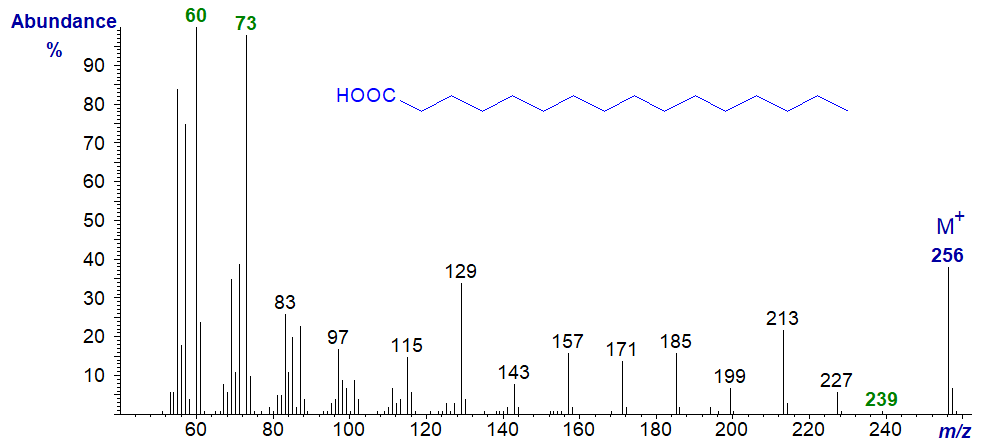
The most abundant ions are at m/z = 60, the McLafferty rearrangement ion, and at m/z = 73 in the lower molecular weight range, but there is an appreciable molecular ion, and there are ions representing fragmentations between methylene groups of the form [HOOC(CH2)n]+ from m/z = 115 to 227. An ion at m/z = 239 ([M−17]+) presumably reflects a loss of OH− from the carboxyl group. Ions at m/z = 227 and 213, represent rearrangements involving expulsion of two (C2 to C3) and three (C2 to C4) carbon units, respectively, as with methyl ester derivatives.
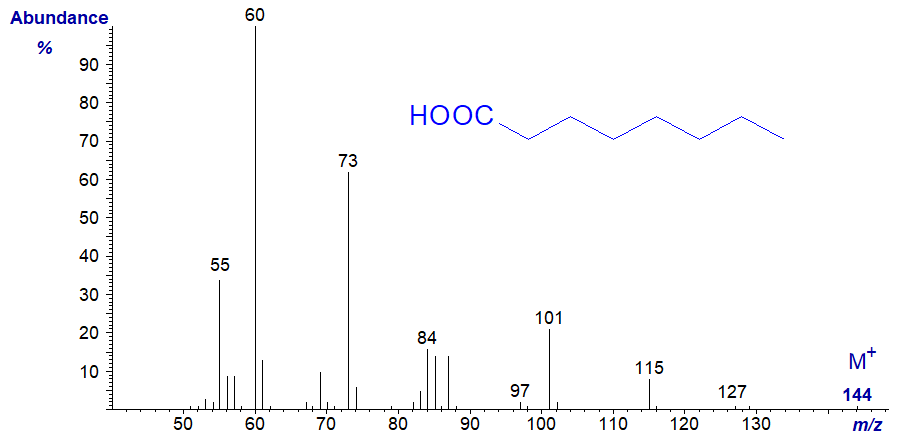
With diminishing molecular weight, the molecular ion is less distinct, but in essence similar features are found in the mass spectra of all saturated fatty acids. For example, that of octanoic acid -
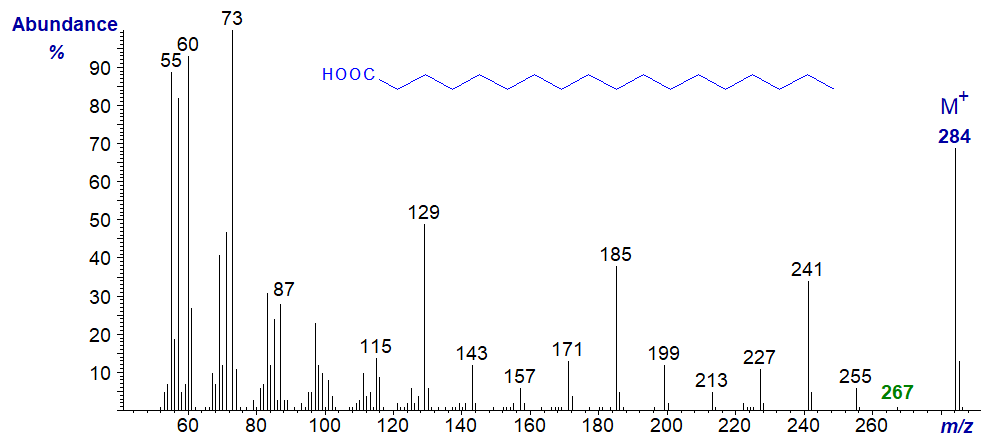
- and that of octadecanoic (stearic) acid -
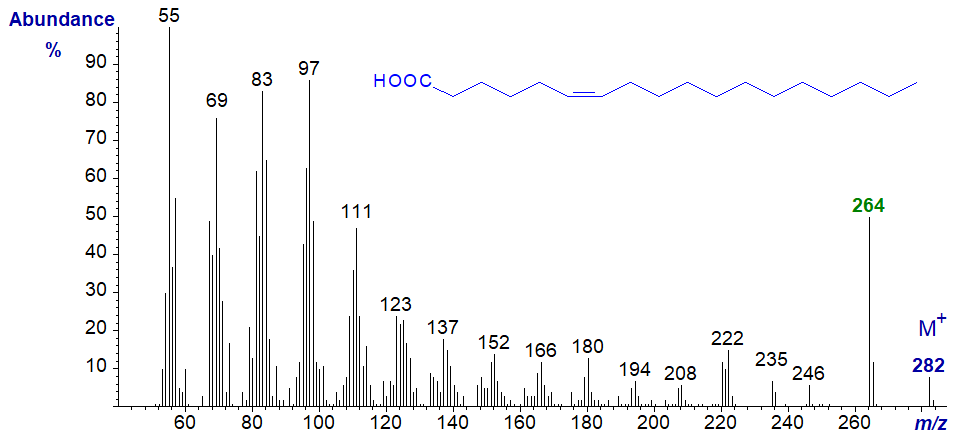
As might be expected the spectra of unsaturated fatty acids are rather different, with hydrocarbon ions (general formula [CnH2n-1]+]) being most abundant, and that of oleic acid (9-18:1) is -
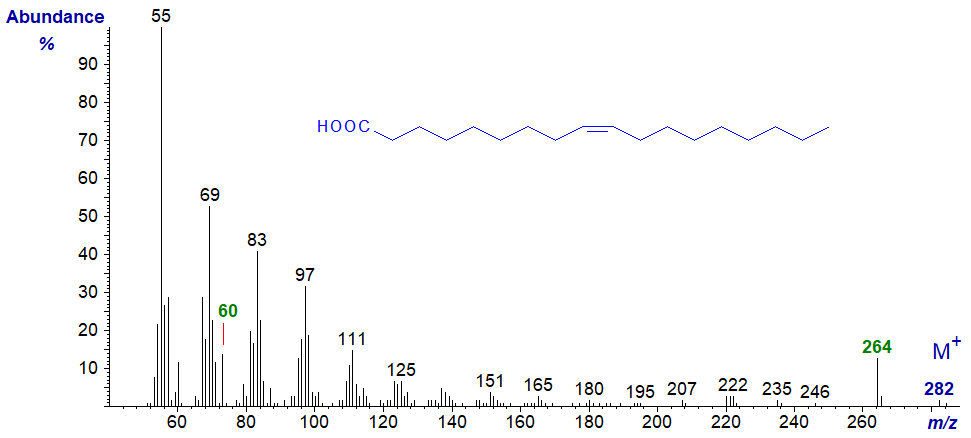
Ions in the low mass range predominate, and the ion representing the loss of the elements of water from the carboxyl group ([M−18]+, m/z = 264) is bigger than the molecular ion. The McLafferty ion at m/z = 60 is relatively small. As expected, there is nothing that might serve to locate the double bond, although the spectrum of the isomeric petroselinic acid (6-18:1) has a slightly different fingerprint (though only reflecting the relative abundance of the unimportant ion at m/z = 55) -
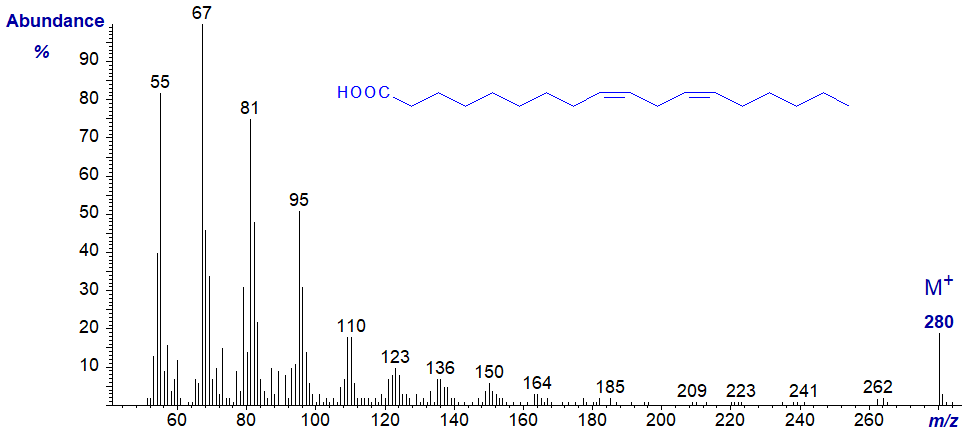
The spectrum of linoleic acid is also dominated by ions in the low mass range. In this instance, the molecular ion is more abundant than any representing the loss of elements of water from the carboxyl group. As with the spectra of methyl esters of dienes, there is nothing that assists in locating the double bonds.
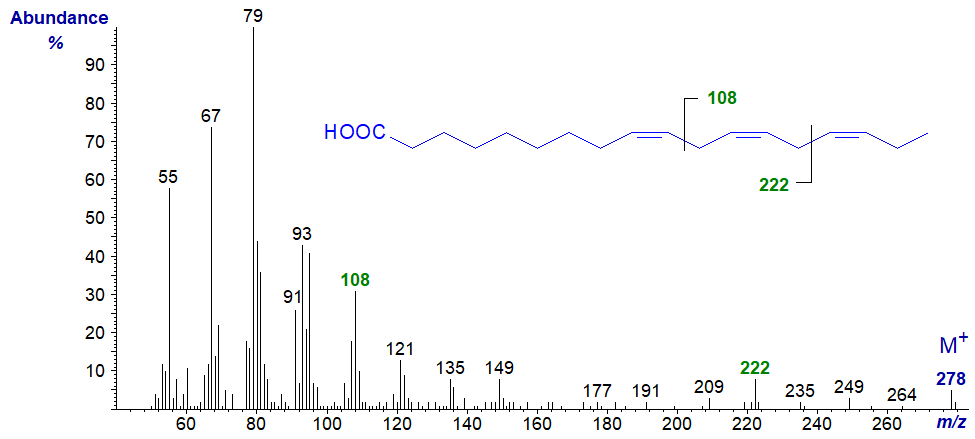
Fatty acids with three or more methylene-interrupted double bonds have structural features in their mass spectra that assist in locating the positions of the double bonds. These are analogous to those found in the spectra of the methyl ester derivatives, i.e., there is an alpha and an omega ion (see our web page on methyl esters of trienes). Because it contains only the terminal structure, the omega ion is the same in both the free acid and other ester derivatives, i.e., at m/z = 108 for fatty acid derivatives of the (n-3) family and at m/z = 150 for fatty acid derivatives of the (n-6) family. On the other hand, the alpha ion contains the carboxyl group and will vary depending on the nature (or presence) of an esterifying moiety.
In the mass spectrum of α-linolenic acid (9,12,15-18:3 or 18:3(n-3)), the omega ion is at m/z = 108, while that for the alpha ion is at m/z = 222.
Spectra of many more free fatty acids are available in our Archive pages, but without interpretation.
Trimethylsilyl Esters
Trimethylsilyl (TMS) esters of fatty acids are rarely prepared as they are very unstable and liable to hydrolysis unless stored in the presence of the silylating reagent, but they may be formed from unesterified fatty acids in silylated lipid extracts from time to time. Again, non-polar GC phases are preferable in the chromatography step, as excess silylating reagent can interact with polar polyester phases. Tulloch, A.P. (1972) has described mechanistic aspects of their mass spectra. The mass spectrum of trimethylsilyl octadecanoate (stearate) is illustrated first –
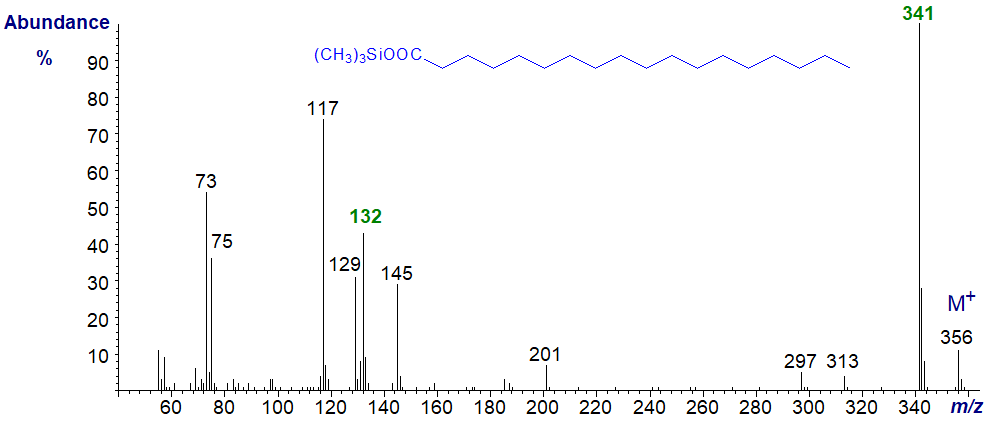
The base ion (m/z = 341) represents the loss of a methyl group from the TMS group, while that at m/z = 132 is the McLafferty rearrangement ion. Ions at m/z = 73 and 75 are typical of all TMS derivatives, although it is somewhat unusual to see both in similar abundance.
Mass spectra of TMS esters of unsaturated fatty acids differ little from that of the saturated isomer. e.g., those of trimethylsilyl oleate and docosenoate -
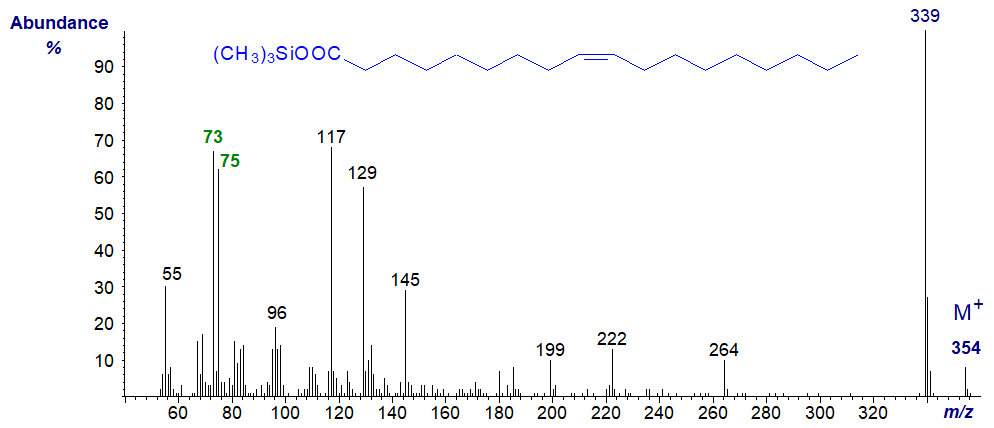

The ions at m/z = 73 and 75 are still of appreciable intensity, but the McLafferty ion at m/z = 132 is no longer prominent. Nothing reveals the positions of the double bonds.
To summarize, little knowledge is gleaned from the spectra other than that a component is a fatty acid of a specific molecular weight, although this is not negligible information, especially when considered along with GC retention data. When there are more double bonds, the spectrum is of little value even as a fingerprint, as that of trimethylsilyl linoleate.

More spectra of TMS esters are available, including those of dicarboxylic and hydroxy acids, in our Archive page.
I can recommend - Christie, W.W. and Han, X. Lipid Analysis - Isolation, Separation, Identification and Lipidomic Analysis (4th edition), 446 pages (Oily Press, Woodhead Publishing and now Elsevier) (2010) - at Science Direct.
References
- Tulloch, A.P. Mass spectra of TMS esters of deuterated decanoic acids and TMS ethers of deuterated decanols. Lipids, 20, 404-411 (1985); DOI.
| © Author: William W. Christie |  |
|
| Updated: November 15th, 2023 | Contact/credits/disclaimer | |
