Mass Spectrometry of Wax Esters
 Wax esters
occur naturally in animal and plant tissues and constitute an important natural lipid class.
Indeed, they are among the most abundant lipids in nature as part of the wax components that cover every green leaf.
In most instances, the fatty acid and alcohol components are saturated or monoenoic,
although polyunsaturated constituents are sometimes found in waxes of marine origin.
The chemistry, biochemistry and biochemistry of wax esters are discussed in the
Lipid Essentials section of this website.
One practical problem that arises in the chromatographic analysis of wax esters or natural origin is that single peaks in
a chromatogram may contain several distinct molecular species, so complicating the interpretation of mass spectra.
The early mechanistic studies of mass spectral fragmentation of was esters were concerned with fully saturated compounds (Aasen et al., 1971; Ryhage and Stenhagen, 1959), and although many spectra may have been published in the intervening years, I have found a comprehensive recent study to be especially valuable (Urbanova et al., 2012). Many of the spectra that follow may not have been published (or at least illustrated) formally elsewhere.
The mass spectrum of hexadecanyl tetradecanoate (14:0acid-16:0alcohol) is -
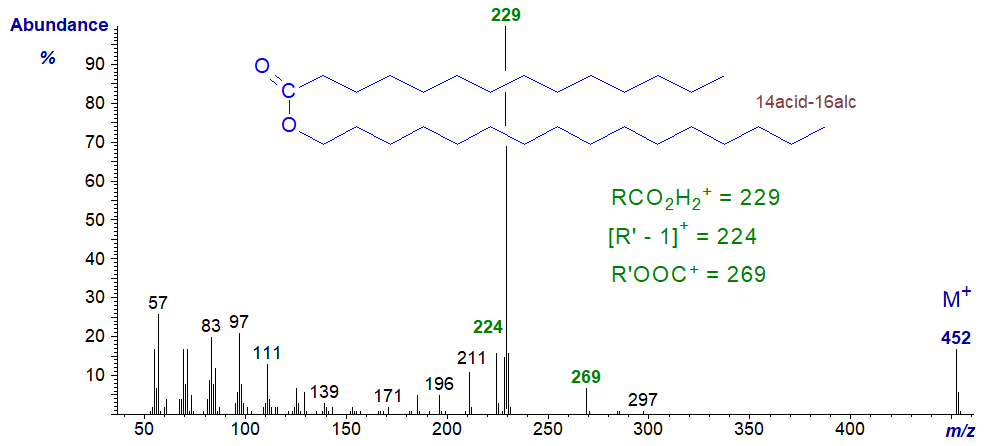
For an ester of the type RCOOR’, the important diagnostic ions are for RCO2H2+, the base ion, i.e., that derived from the acid component at m/z = 229 in this instance, for [R’−1]+ (m/z = 224) derived from the alcohol moiety, and for R’OOC+ (m/z = 269 or alcohol moiety plus carboxyl group). There is no dubiety about the molecular ion (m/z = 452), but all other ions, including the McLafferty rearrangement ion, are small.
For comparison, the mass spectrum of the isomeric tetradecanyl hexadecanoate (16:0acid-14:0alcohol) is –
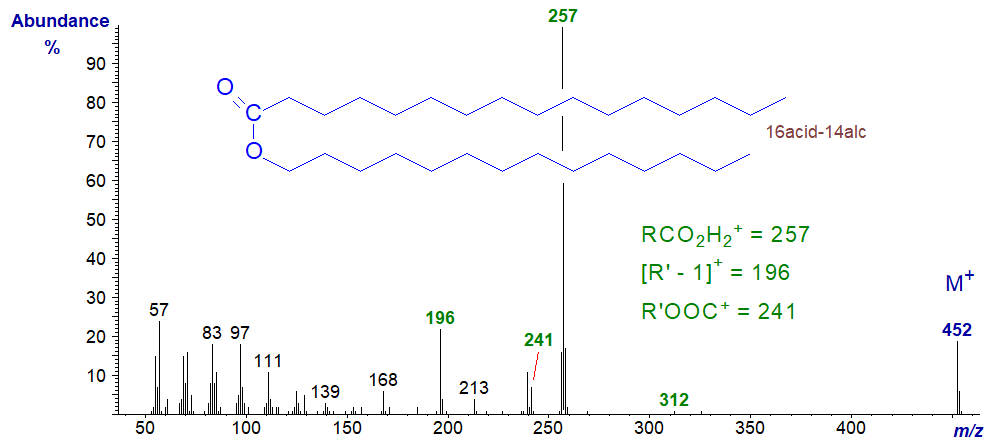
In this example, the important diagnostic ions are for RCO2H2+ (at m/z = 257), for [R’−1]+ (m/z = 196), and for R’OOC+ (m/z = 241). The McLafferty rearrangement ion at m/z = 312 is just discernible. This compound and the previous one may occur together in many natural samples and will emerge as a single peak on most chromatographic systems (with other species of the same molecular weight) to complicate any interpretation of the spectra.
Mass spectrum of octadecanyl hexadecanoate (16acid-18alcohol) -
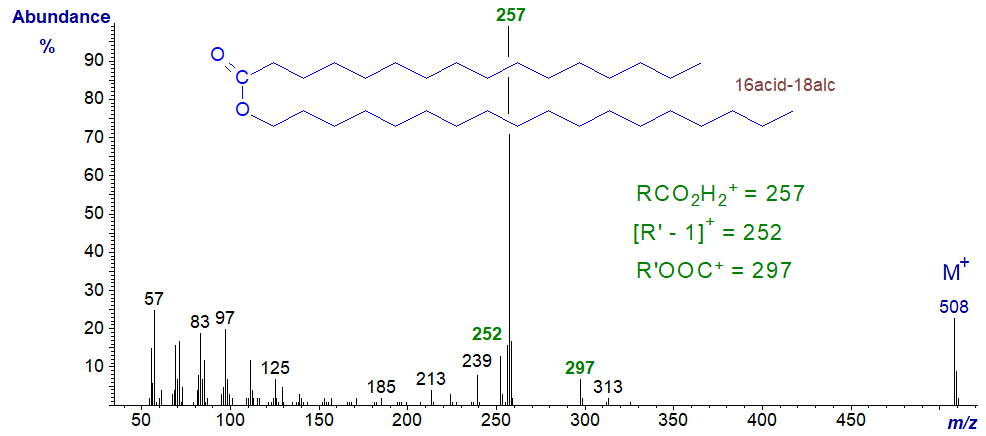
Interpretation of the spectrum is as for the previous two, and the diagnostic ions are marked in the figure.
The mass spectra of unsaturated wax esters are somewhat different in that ions containing the double bond tend to dominate (Spencer, 1979). That of octadecanyl hexadecenoate (16:1acid-18:0alcohol), i.e., with a double bond in the fatty acid component is -
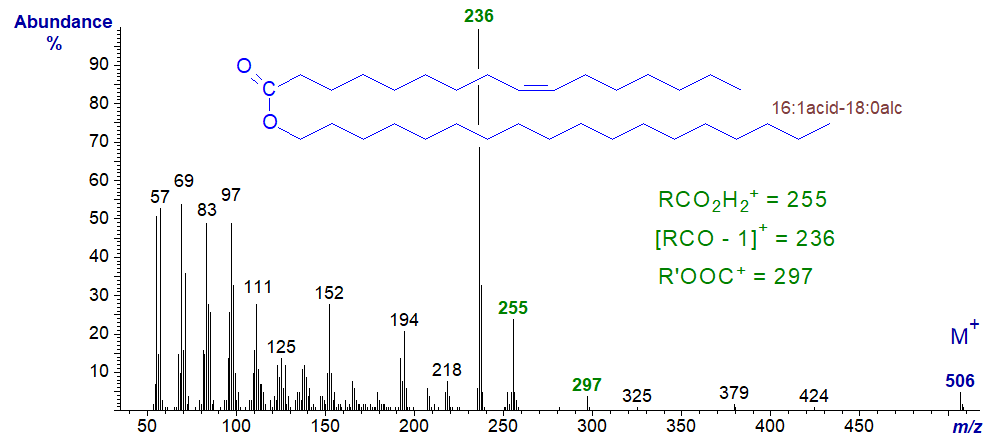
The base ion at m/z = 236 now represents [RCO−1]+, while the other diagnostic ions for RCO2H2+ (at m/z = 255), for [R’−1]+ (m/z = 252) and for R’OOC+ (m/z = 297), together with the molecular ion, are much smaller than in fully saturated wax esters.
In the mass spectrum of eicosanyl octadecenoate (18:1acid-20:0alcohol), the same diagnostic ions are present, but each is increased by 28 amu -
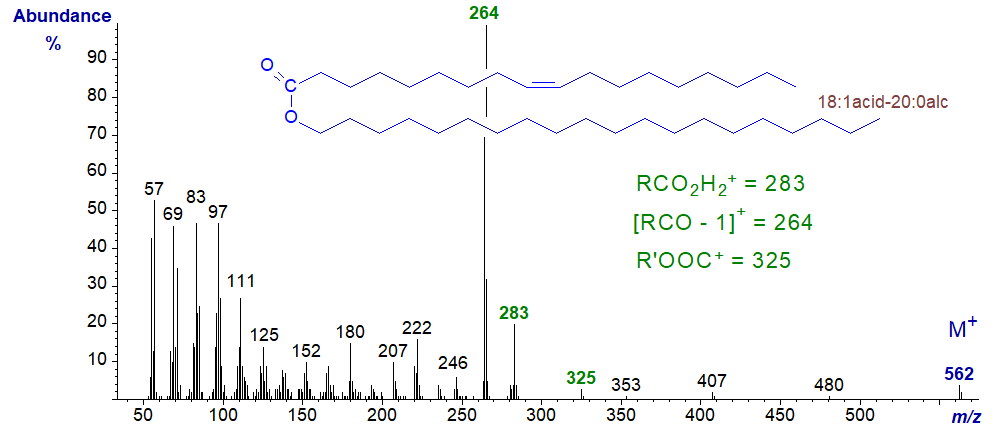
For comparison, the mass spectrum of the isomeric octadecenyl hexadecanoate (16:0acid-18:1alcohol), i.e., with the same molecular weight but with a double bond in the fatty alcohol component is –
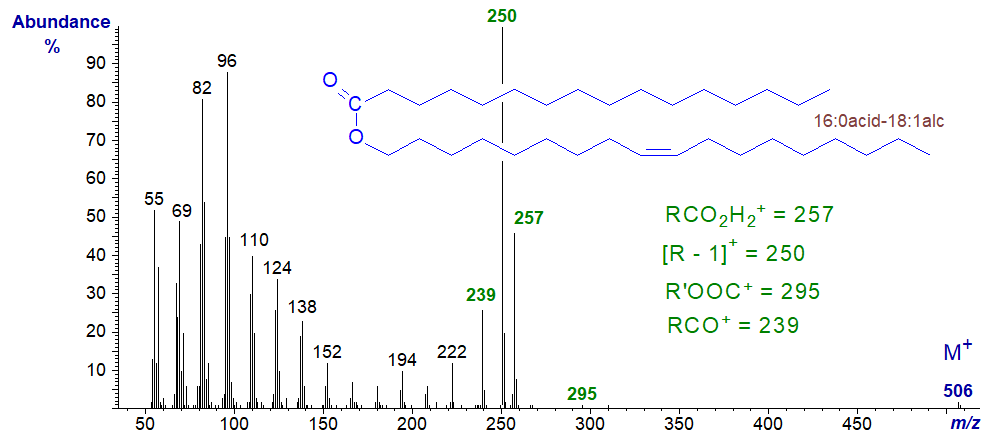
Now the base ion is the [R’−1]+ ion at m/z = 250, i.e., derived from the alcohol component, while other useful ions are for RCO2H2+ (m/z = 257), RCO+ (m/z = 239) and R’OOC+ (m/z = 295).
Wax esters of aromatic acids such as ferulic, caffeic and coumaric acids are found in plant cutins and are usually converted to the trimethylsilyl ethers for analysis by GC-MS. The following spectrum was kindly provided by Isabel Molina, Mike Pollard and John Ohlrogge. Mass spectrum of octadecyl ferulate - trimethylsilyl ether -
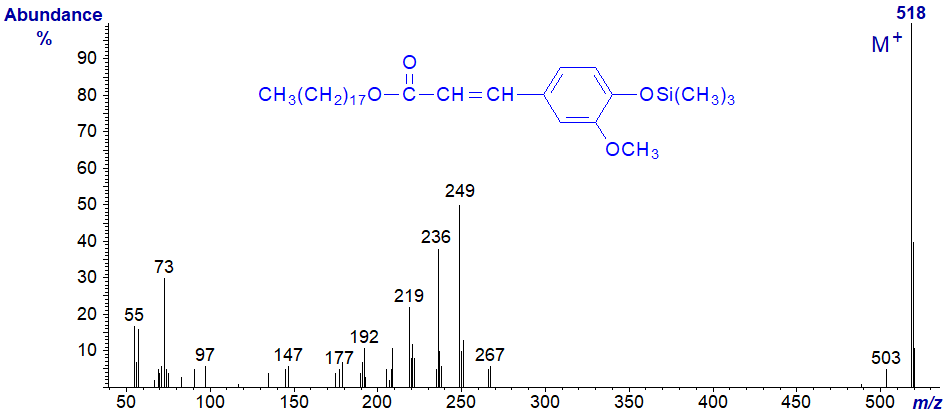
I could speculate on the identity of many of the ions, but it is probably wiser simply to present this as a fingerprint.
Mass spectra of more wax esters are available in our Archive pages.
References
- Aasen, A.J., Hofstetter, H.H., Iyengar, B.T.R. and Holman, R.T. Identification and analysis of wax esters by mass spectrometry. Lipids, 6, 502-507 (1971); DOI.
- Ryhage, R. and Stenhagen, E. Mass spectrometric studies II. Saturated normal long-chain esters of ethanol and higher alcohols. Arkiv Kemi, 14, 483-495 (1959).
- Spencer, G.F. Alkyloxy-acyl combinations in the wax esters from winterised sperm oil by gas chromatography-mass spectrometry. J. Am. Oil Chem. Soc., 56, 642-646 (1979); DOI.
- Urbanova, K., Vrkoslav, V., Valterova, I., Hakova, M. and Cvacka, J. Structural characterization of wax esters by electron ionization mass spectrometry. J. Lipid Res., 53, 204-213 (2012); DOI.
I can recommend - Christie, W.W. and Han, X. Lipid Analysis - Isolation, Separation, Identification and Lipidomic Analysis (4th edition), 446 pages (Oily Press, Woodhead Publishing and now Elsevier) (2010) - at Science Direct.
| © Author: William W. Christie |  |
|
| Updated: June 2025 | Contact/credits/disclaimer | |
© The LipidWeb is open access and fair use is encouraged but not text and data mining, AI training, and similar technologies.
