Mass Spectrometry of Methyl Esters
Dicarboxylic Fatty Acids
Dicarboxylic fatty acids are not often present as such in nature, although they are occasionally found in plants and especially in plant cutin and suberin. For example, they are major components of cork, i.e., a product of the outer layer of the bark of the cork oak (Quercus suber). Short-chain dicarboxylic acids may be encountered in the oxidative degradation of lipids. While commercial standards were used to obtain some of the mass spectra of methyl esters that follow, others were obtained from analyses of cork and other cutin hydrolysates. Spectra for 3-pyridylcarbinol ('picolinyl') esters and DMOX derivatives with pyrrolidides are described in separate documents. Few of these have been illustrated elsewhere but references to spectra published previously are cited where we are aware of them.
Dimethyl esters of saturated dicarboxylic acids have characteristic mass spectra (Ryhage and Stenhagen, 1959; McCloskey, 1970), which show a distinctive pattern in the high mass range that typically consists of a small molecular ion, a significant ion equivalent to m/z = [M−31]+ and others representing m/z = [M−64]+, [M−73]+, [M−92]+, [M−105]+ and [M−123]+.
| [M−31]+ = loss of CH3O |
| [M−64]+ = loss of 2 x CH3O |
| [M−73]+ = loss of CH3OCOCH2 (McLafferty ion) |
| [M−92]+ = loss of CH3OCO + CH3O + 2H |
| [M−105]+ = loss of CH3OCOCH2 + CH3O + H |
| [M−123]+ = loss of CH3OCOCH2 + CH3O + H2O + H |
A second series of abundant ions is found at m/z = 84 + 14n that is not present in the mass spectra of methyl esters of equivalent monocarboxylic acids; these are believed to be cyclic enols formed by rearrangement processes. The relative abundances of the two series appear to depend on chain-length. Although the McLafferty ion at m/z = 74 is usually prominent, the series [CH3OOC(CH2)n]+ tends to peter out quickly as the chain length increases.
To illustrate this, the mass spectrum of the dimethyl 1,9-nonanedioate (dimethyl azeleate) is -
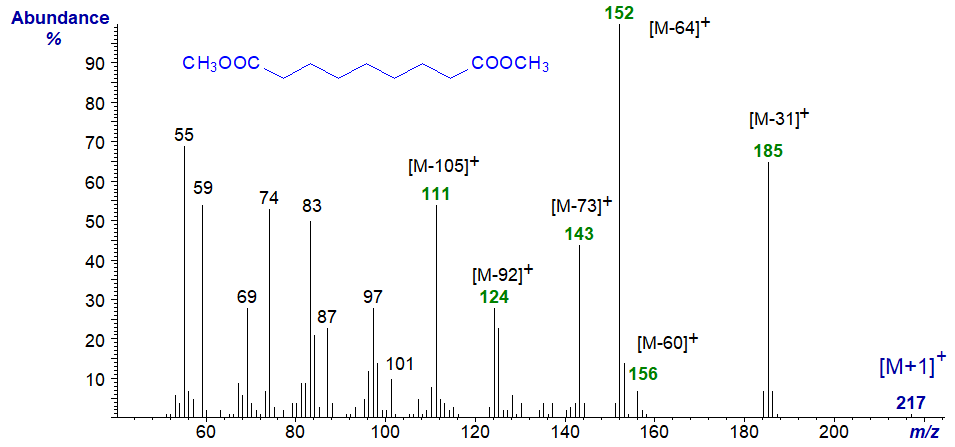
The most abundant ions are in the high mass range, i.e., m/z = 185 ([M−31]+), 152 ([M−64]+), 143 ([M−73]+), 124 ([M−92]+) and 111 ([M−105]+). Ions at m/z = 83, 97 and 111 (in part) are presumably those expected of the m/z = 83/4 + 14n series. Ions equivalent to [M−60]+ (m/z = 156 in this instance for loss of CH3OCO + H) seem to be characteristic of shorter-chain dibasic esters.
The mass spectrum of dimethyl 1,18-octadecanedioate is –
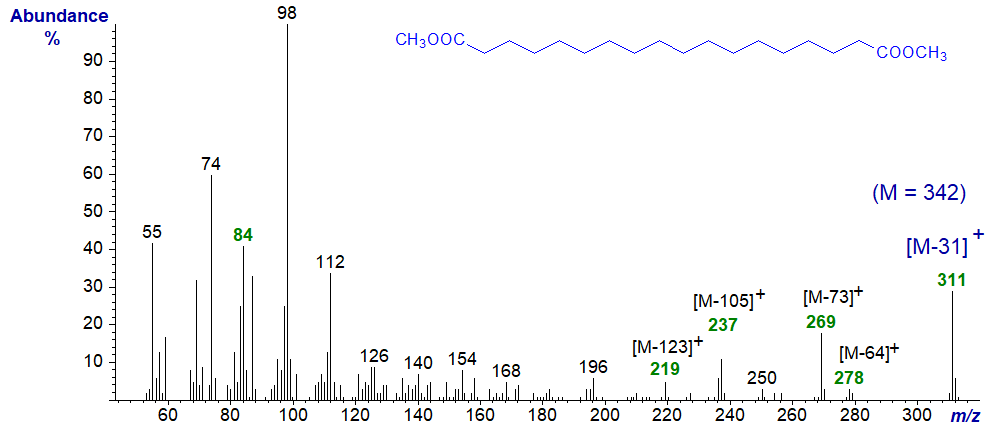
The molecular ion is not seen in this instance without considerable magnification of the appropriate region of the spectrum. Here, the ions of the m/z = 84 + 14n series are most abundant with the base ion at m/z = 98. Instead, the ions representing [M−64]+, [M−73]+, [M−92]+, [M−105]+ and [M−123]+ are all easily recognized.
Dicarboxylic acids with a single methyl group on position 2 are known, and the spectrum of dimethyl (2-methyl)-tricosane-1,23-dioate is -
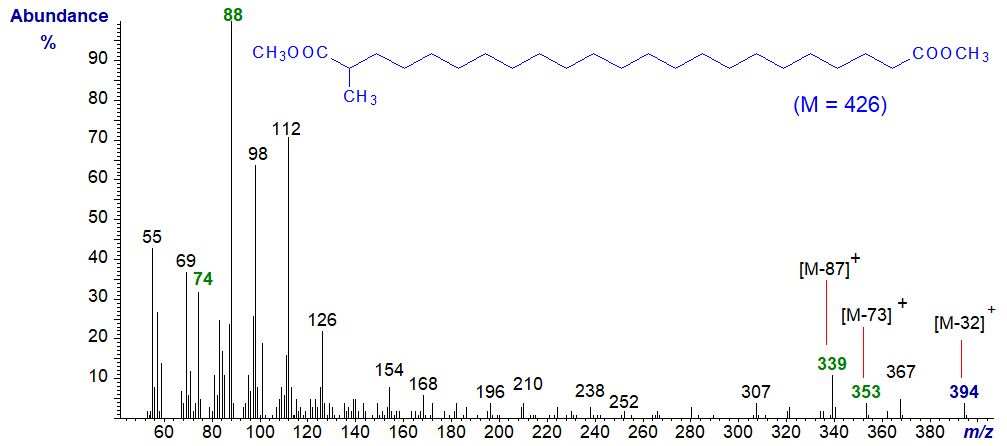
There is no detectable molecular ion in this instance, but there are two McLafferty ions, the normal one at m/z = 274 and one for the carboxyl adjacent to the methyl branch at m/z = 88, which is in fact the base ion. As expected, there are ions for loss of methanol and of the two McLafferty ions as indicated on the spectrum. Otherwise, the ions of the series m/z = 84 + 14n at 98, 112, 126 and so forth are the only ones of interest.
Unsaturated dibasic acids are not often encountered in nature other than in plant cutins, but the mass spectrum of dimethyl 1,18-octadec-9-enedioate (derived from oleate) is appreciably different from those of saturated esters, although there is no feature that locates the double bond as might be expected –
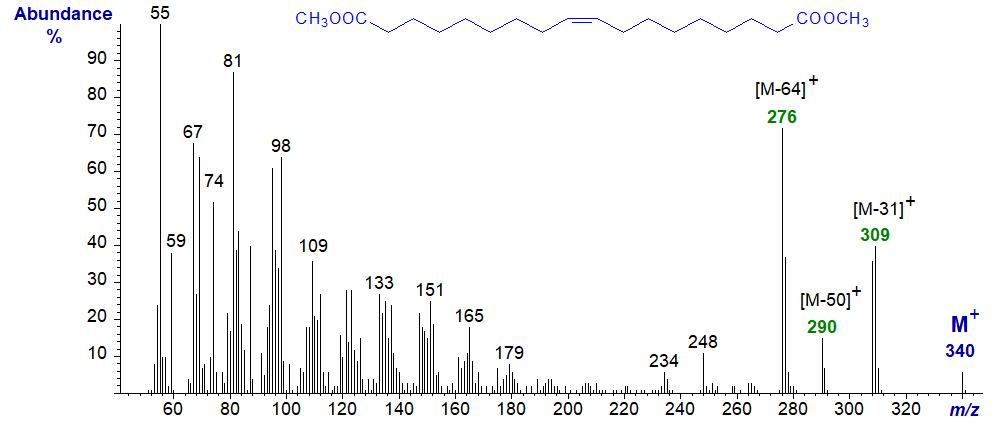
In this instance, there is a small but distinct molecular ion, and ions at m/z = 309 ([M−31]+), 276 ([M−64]+) and 248 ([M−92]+), equivalents of which were present in the spectrum of the analogous saturated fatty acid, though very different in magnitude. There is still an appreciable McLafferty ion (m/z = 74), but ions for the series m/z = 84 + 14n tend to be less abundant than those of the m/z = 81 + 14n series.
The mass spectrum of the dienoic analogue, also a common component of plant suberin, i.e., of dimethyl 1,18-octadeca-6,9-dienedioate (derived from linoleate) is -
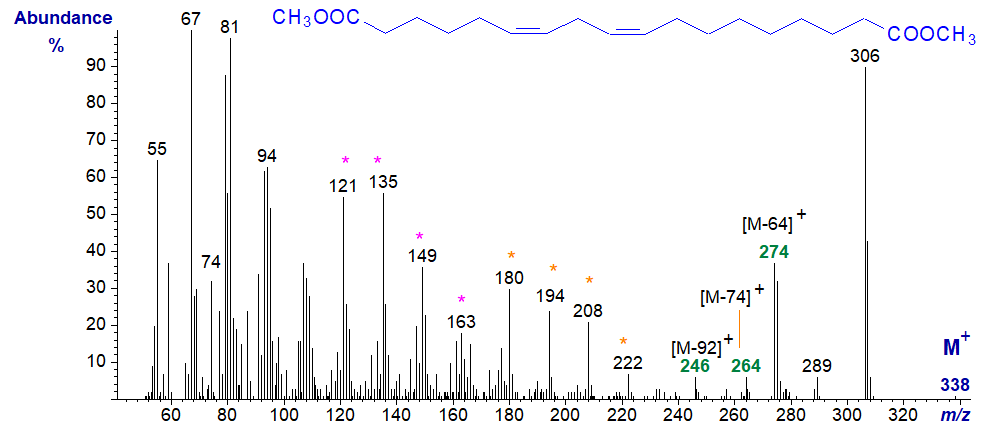
There is again a small molecular ion, and ions equivalent to [M−32]+, [M−64]+, [M−74]+ and [M−92]+, as indicated on the spectrum, in addition to the McLafferty ion at m/z = 74. Two homologous series of ions at m/z = 121, 135, 149 and 193 and at m/z = 180, 194, 208 and 222, are noteworthy, but as usual I hesitate to speculate on their identity in print as this may be given undue credence (my readers may find it an interesting exercise). As with the previous spectrum and in common with methyl esters of most monoenes and dienes, there are no ions that serve to locate the double bonds in the chain, although they are known to be of the cis configuration. On the other hand, the dimethyloxazoline (DMOX) derivatives do permit confirmation of the positions of double bonds. The above spectrum was illustrated previously by Bonaventure et al. (2004).
Epoxy- and dihydroxy-dicarboxylic acids (the latter can be obtained inadvertently from the former during hydrolysis-derivatization) have been identified in plant cutins, and the mass spectrum of dimethyl 9,10-dihydroxy-1,18-octadecadienoate is illustrated next.
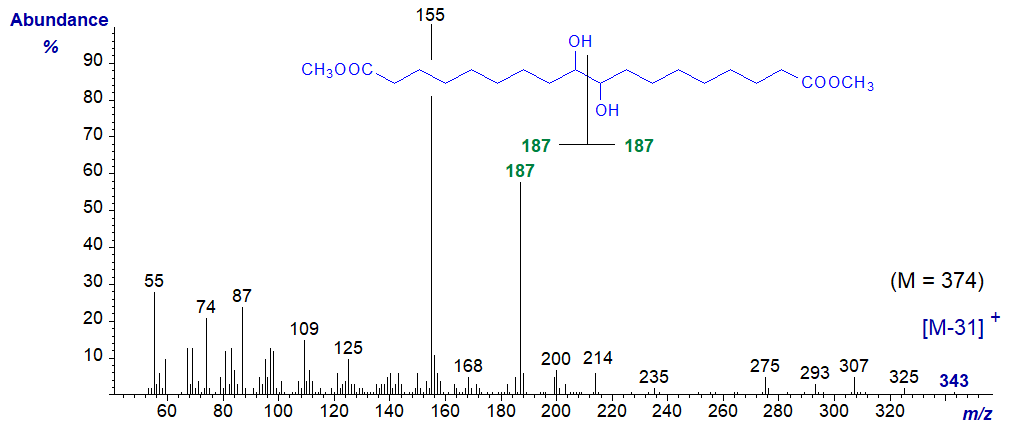
The molecule is symmetrical, and simplistically the ion at m/z = 187 is produced by cleavage between the carbons containing the two hydroxyl groups to give two equal fragments, while the base ion at m/z = 155 is formed from these by loss of the elements of methanol. While the molecular ion is not detectable, there is an ion representing the loss of methanol at m/z = 343 ([M‑31]+) that can be used to determine the molecular weight.
The mass spectrum of the trimethylsilyl ether derivative of dimethyl 9,10-dihydroxy-1,18-octadecadienoate is even less distinctive -
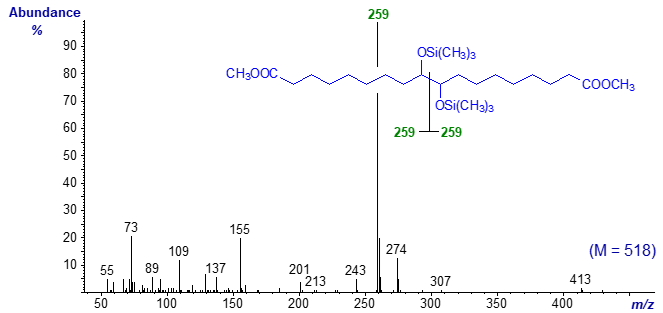
- although the ion representing cleavage between the two hydroxyl groups is again of diagnostic value.
There are more spectra of methyl esters of di- and some tricarboxylic acids, including trimethylsilyl ethers of hydroxy-dicarboxylic acids, in our Archive section.
Acknowledgement: The mass spectrum of dimethyl (2-methyl)-tricosane-1,23-dioate illustrated above and of derivatives of many more cutin components in our Archive sections were kindly supplied by Isabel Molina (Algoma University, Sault Ste Marie, ON, Canada) and Mike Pollard & John Ohlrogge (Michigan State University, East Lansing, MI, USA).
References
- Bonaventure, G., Beisson, F., Ohlrogge, J. and Pollard, M. Analysis of the aliphatic monomer composition of polyesters associated with Arabidopsis epidermis: occurrence of octadeca-cis-6, cis-9-diene-1,18-dioate as the major component. Plant J., 40, 920-930 (2004); DOI.
- McCloskey, J.A. Mass spectrometry of fatty acid derivatives. In: Topics in Lipid Chemistry. Volume 1, pp. 369-440 (ed. F.D. Gunstone, Logos Press, London) (1970).
- Ryhage, R. and Stenhagen, E. Mass spectrometric studies. III. Esters of saturated dibasic acids. Arkiv Kemi, 4, 497-509 (1959).
I recommend - Christie, W.W. and Han, X. Lipid Analysis - Isolation, Separation, Identification and Lipidomic Analysis (4th edition), 446 pages (Oily Press, Woodhead Publishing and now Elsevier) (2010) - at Science Direct.
| © Author: William W. Christie |  |
|
| Updated: June 2025 | Contact/credits/disclaimer | |
© The LipidWeb is open access and fair use is encouraged but not text and data mining, AI training, and similar technologies.
