Lipidomics studies on macrophages
Details: PGF1a
|
 : View time course graphs
| Details | Graph
| LM_ID | Name | Kdo+ATP ATP Kdo Ctrl 0 hrs |
Kdo+ATP ATP Kdo Ctrl 15 min |
Kdo+ATP ATP Kdo Ctrl 30 min |
Kdo+ATP ATP Kdo Ctrl 1 hr |
Kdo+ATP ATP Kdo Ctrl 2 hrs |
Kdo+ATP ATP Kdo Ctrl 4 hrs |
Kdo+ATP ATP Kdo Ctrl 8 hrs |
Kdo+ATP ATP Kdo Ctrl 20 hrs |
Units . . . . | ||
|---|---|---|---|---|---|---|---|---|---|---|---|---|---|---|
 |
Legend:
Legend: (MSG090908) | LMFA03010137 | PGF1a | - - - 0.003 |
0.102 0.047 0.049 0.054 |
0.179 0.088 0.057 0.073 |
0.137 0.056 0.077 0.069 |
0.147 0.085 0.067 0.1 |
0.179 0.078 0.102 0.118 |
0.186 0.107 0.072 0.107 |
0.302 0.155 0.096 0.088 |
pmol/ug DNA | ||
|
Legend:
Legend: (MSG090909) | LMFA03010137 | PGF1a | - - - 0.042 |
0.119 0.053 - - |
0.079 0.027 0.008 - |
0.047 0.036 - - |
0.058 0.057 - - |
0.077 0.028 - - |
0.096 0.043 - - |
0.17 0.077 0.006 - |
pmol/ug DNA | ||
|
Legend:
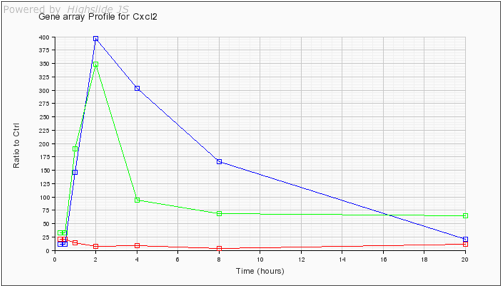
Legend: (MSG090909) | LMFA03010137 | PGF1a | - - - 0.06 |
0.092 0.08 0.064 0.062 |
0.164 0.114 0.071 0.056 |
0.14 0.099 0.068 0.04 |
0.103 0.283 0.07 0.037 |
0.194 0.128 0.08 0.053 |
0.227 0.102 0.101 0.054 |
0.352 0.145 0.082 0.076 |
pmol/ug DNA |