Mass Spectrometry of Monoacyl/alkylglycerol
and Diacylglycerol Derivatives
We have limited experience of the analysis of alkylglycerols and 1/2-monoacylglycerols by gas-chromatography-mass spectrometry, so can only attempt a brief account here. 1-Alkylglycerols are often present in fish oils, especially in those from shark species, but we have only rarely encountered monoacylglycerols in a situation where analysis of the intact lipid was necessary in our own work. Nicotinates can be used for analysis, and they permit direct determination of double bond positions and branch points in the alkyl chain (Harvey, D.J., 1991), although regretfully we have only a few spectra available that are relevant to diacylglycerols. As with other documents on this, only spectra encountered in our own research work can be illustrated. This is intended as a practical rather than a mechanistic guide, so fragmentations are over simplified.
Monoacylglycerols
Monoacylglycerols are analysed most conveniently in the form of the trimethylsilyl ether derivatives, as the (1/3)- and 2-isomers are easily separated by gas chromatography, and each has a characteristic mass spectrum (Johnson, C.B. and Holman, R.T., 1966; Myher J.J. et al., 1974).
The mass spectrum of the trimethylsilyl ether derivative of 1-monoheptadecanoin is –
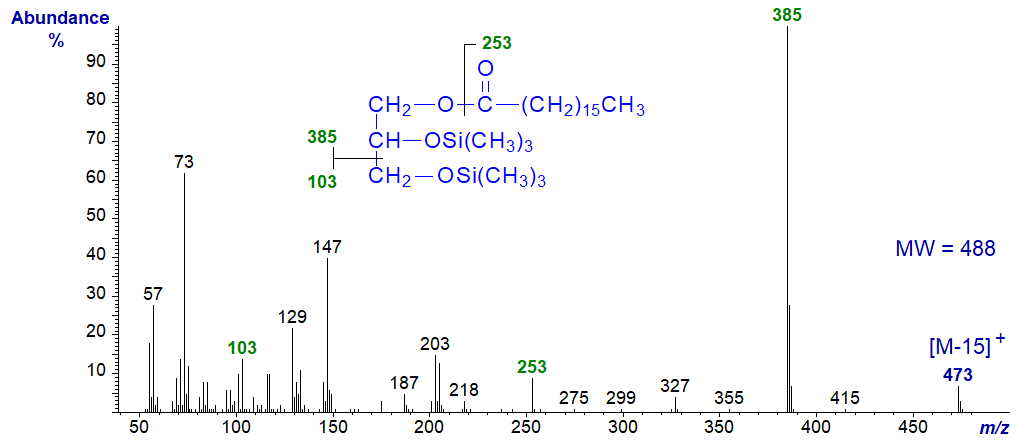
The molecular ion is not normally significant with saturated isomers but is more abundant with unsaturated analogues. An ion representing [M‑15]+ at m/z = 473 in this instance serves to determine the molecular weight. The base ion at m/z = 385 or [M‑103]+ represents cleavage between carbons 1(3) and 2 of the glycerol moiety as illustrated. An ion at m/z = 253 for the acyl moiety is of moderate intensity (10-20%) and is in a distinctive region of the spectrum, while ions at m/z = 129 and 147 are useful diagnostic markers.
The mass spectrum of the trimethylsilyl ether derivative of 2-monoheptadecanoin is very different, though again the molecular ion is absent, and we have to use the ion at [M-15]+ at m/z = 473 for confirmation.
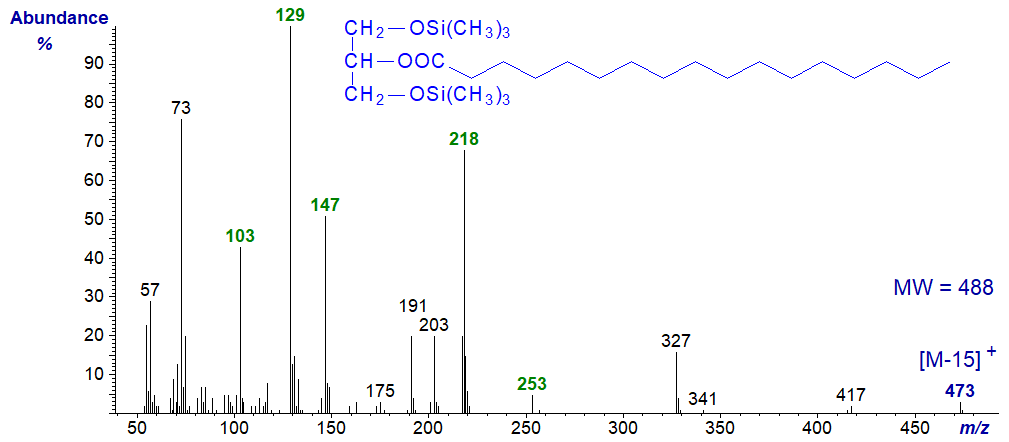
Ions containing one or both of the silicon atoms dominate the spectrum, e.g., m/z = 103, 129, 147 and 218, and depending on the molecular weight and degree of unsaturation of the fatty acid chain that at m/z = 129 or 218 can be the most abundant. The second of these represents the ion remaining after the loss of the acyloxy moiety, while the ion at m/z = 253 for the acyl moiety is present but of low intensity.
Glycerol Ethers (1-Alkylglycerols)
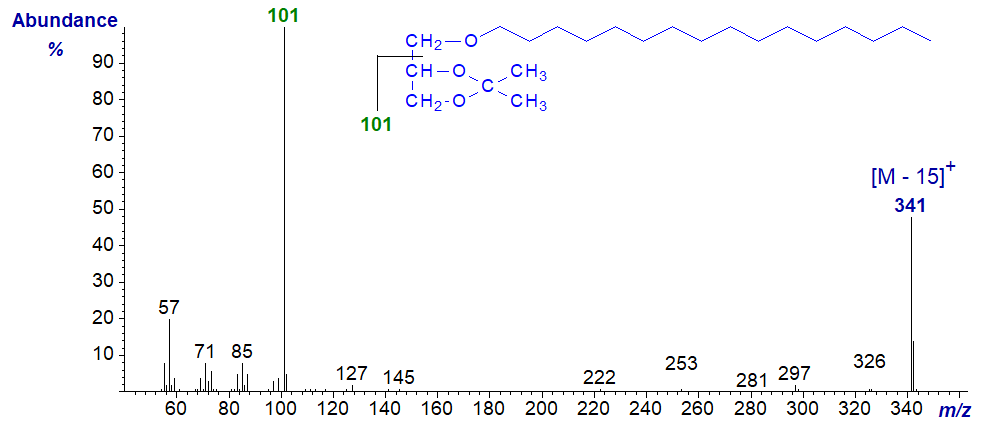
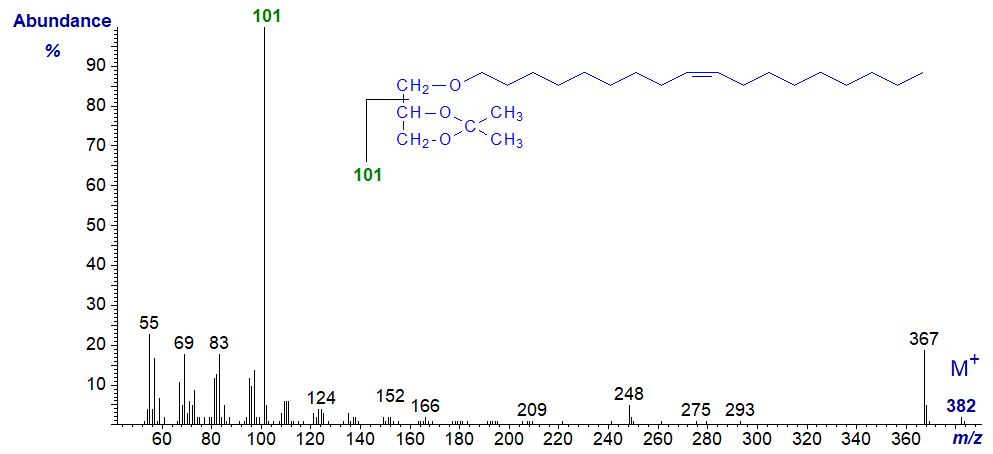
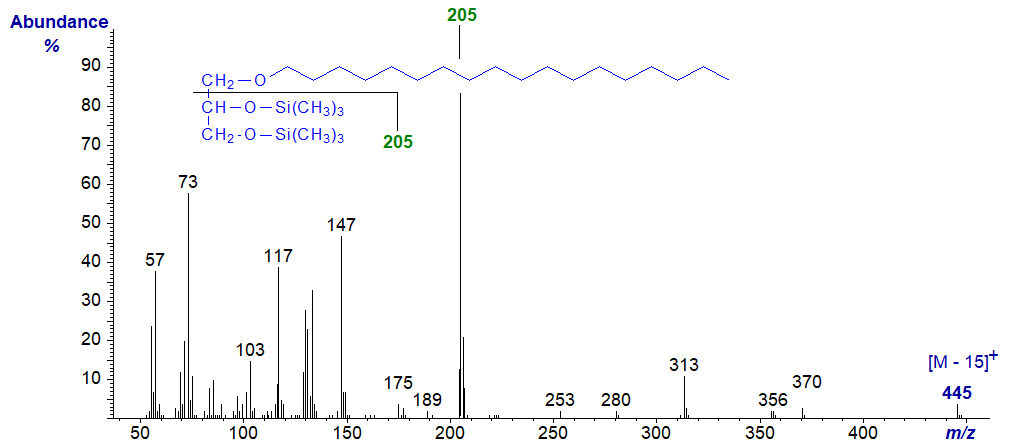
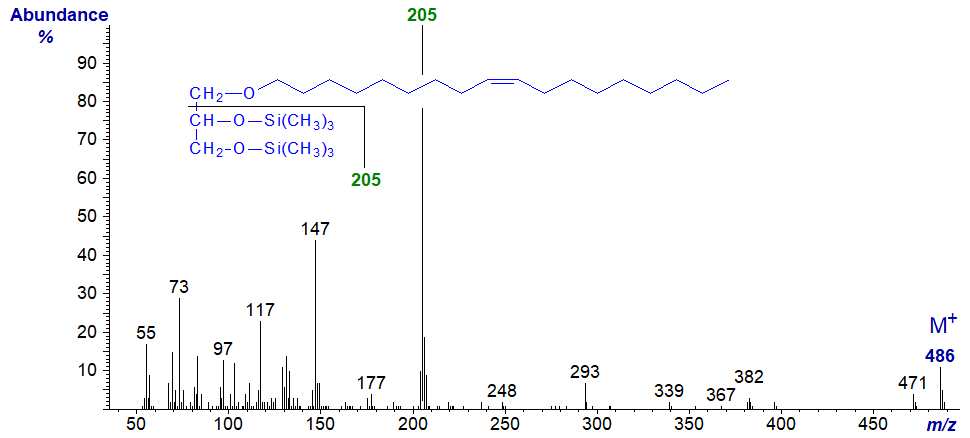
Glycerol ether lipids are common in nature and can be major components of some shark oils, from which the following spectra were obtained. They are prepared usually by hydrolysis of the lipids followed by isolation of the non-saponifiable fraction. For analysis by GC-MS, as with the aliphatic 1,2-diols, they can be converted to either the isopropylidene derivatives or the TMS ethers (or presumably to dinicotinates, although we have no relevant spectra available). Neither of these derivatives may give a recognizable molecular ion, especially with saturated species, and an [M‑15]+ ion (loss of a methyl group from the derivatizing moiety) is often that of highest mass to be detected, but unsaturated bis-trimethylsilyl ether derivatives may give a respectable molecular ion. In general, these spectra are not very interesting, as the main cleavage occurs between carbons 1 and 2 of the glycerol moiety, so that the base ion is for the fragment with the derivatizing group (Myher, J.J. et al., 1974). Some representative spectra are illustrated below without further discussion.
Mass spectrum of 1-O-hexadecylglycerol - isopropylidene derivative -
Mass spectrum of 1-O-octadec-9-enylglycerol - isopropylidene derivative -
Mass spectrum of 1-O-hexadecylglycerol - bis-trimethylsilyl ether derivative -
Mass spectrum of 1-O-octadec-9-enylglycerol - bis-trimethylsilyl ether derivative -
Further spectra of glycerol ethers in the form of both types of derivative are available in the Archive section of this site, but without interpretation.
Diacylglycerols Derived from Phospholipids
A common approach to the analysis of phospholipids consists in enzymatic hydrolysis to the diacylglycerols followed by conversion to UV-absorbing derivatives for separation by liquid chromatography. While most such derivatives offer little useful structural information when subjected to mass spectrometry, nicotinates are an important exception. Not only do they permit identification of which fatty acid is esterified to each position, but they allow location of the double bonds in the fatty acyl chains, while separations can also be monitored by UV absorption. The following spectra were obtained by separation of molecular species by reversed-phase HPLC on a base-deactivated ODS column, with particle-beam electron-impact mass spectrometry (Dobson et al., 1998). The spectra below have been adapted from this paper, where much more detailed interpretation is offered than is appropriate here. Zollner and Schmid (1996) were the first to use this methodology.
The mass spectrum of the nicotinate derivative of 1,2-diolein is illustrated first -
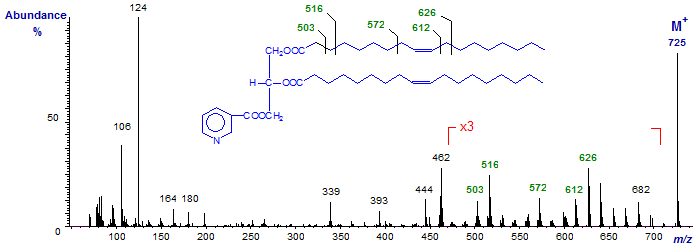
There is an abundant molecular ion, together with the ions at m/z = 106/7 and 124 for fragmentations at the nicotinoyl moiety. Ions at m/z = 444 ([M−RCOO]+) and 462 ([M−RCO+2]+) establish the size of the acyl moieties. The distinctive fragments shown serve to locate the double bonds in the chain. It is noteworthy that there is no dubiety about the molecular ion.
Next follow the mass spectra of the nicotinate derivatives of both 1-palmitoyl-2-oleoyl-glycerol and 1-oleoyl-2-palmitoyl-glycerol -

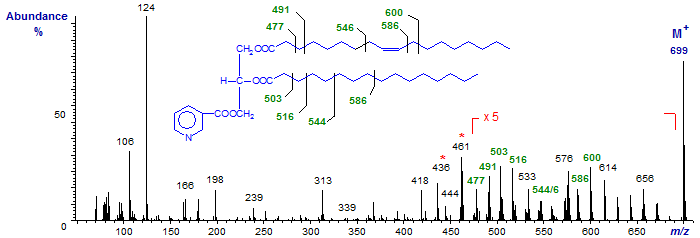
The spectra are qualitatively similar, but differ in the relative abundance of specific ions that serve to determine the nature of the acyl-chains, specifically at m/z = 436 (or [M−RCO+2]+) and 461 ([M−R'CO+1]+; not at m/z = 462 as for diolein).
Methods for the preparation of nicotinates are described in our web page on Nicotinate derivatives of fatty alcohols, while those for isopropylidene derivatives and TMS ethers are discussed with Other derivatives of fatty alcohols.
References
- Christie, W.W. and Han, X. Lipid Analysis - Isolation, Separation, Identification and Lipidomic Analysis (4th edition), 446 pages (Oily Press, Woodhead Publishing and now Elsevier) (2010) - see Science Direct.
- Dobson, G., Itabashi, Y., Christie, W.W. and Robertson, G.W. Liquid chromatography with particle-beam electron-impact mass spectrometry of diacylglycerol nicotinates. Chem. Phys. Lipids, 97, 27-39 (1998); DOI.
- Harvey, D.J. Application of nicotinate derivatives to the structural determination of glycerol ethers. Biol. Mass Spectrom., 20, 303-307 (1991); DOI.
- Johnson, C.B and Holman, R.T. Mass spectrometry of lipids. II. Monoglycerides, their diacetyl derivatives and their trimethylsilyl ethers. Lipids, 1, 371-380 (1966); DOI.
- Myher, J.J., Marai, L. and Kuksis, A. Identification of monoacyl- and monoalkylglycerols by gas-liquid chromatography-mass spectrometry using polar siloxane liquid phases. J. Lipid Res., 15, 586-592 (1974); DOI.
- Zollner, P. and Schmid, R. Utility of nicotinoyl derivatives in structural studies of mono- and diacylglycerols by GC/MS. Part 3. Application to acylglycerols with methyl branchings and epoxy and cyclopropyl rings. J. Mass Spectrom., 31, 411-417 (1996); DOI.
| © Author: William W. Christie |  |
|
| Updated: June 2025 | Contact/credits/disclaimer | |
© The LipidWeb is open access and fair use is encouraged but not text and data mining, AI training, and similar technologies.
