Mass Spectrometry of Methyl Esters
Saturated Branched-Chain Fatty Acids
 As
cautioned in the 'Introduction' to these documents, the mass spectra of
methyl esters sometimes afford limited information only concerning the structures of fatty acids.
Molecular weights are usually obtainable and are important for identification, as are gas chromatographic retention data.
However, many saturated methyl-branched fatty acids can be identified from
the mass spectra of their methyl ester derivatives, especially when spectra of model compounds are available for comparison purposes.
Only those spectra encountered in my own research can be described in detail here, leaving some regrettable gaps in my account,
but the references listed provide further information.
There is a document on the chemistry and occurrence of branched-chain fatty acids on this site
here...
The definitive paper on the mass spectra of methyl esters of mono-methyl-branched fatty acids has data for the complete series 2- to 17‑methyl-octadecanoates (Apon and Nicolaides,1975), although much of the data for the more important acids from a biological standpoint were published earlier (Ryhage and Stenhagen, 1959). Some representative spectra are illustrated below with brief details of interpretation only. Although they are arguably not ideal derivatives for the purpose, many natural branched-chain fatty acids have been successfully characterized by means of mass spectrometry of their methyl esters. 3-Pyridylcarbinol (‘picolinyl’) esters and pyrrolidides are the best derivatives in this instance (see the appropriate sections of these web pages), but dimethyloxazoline derivatives are less suitable, especially for the iso- and anteiso-methyl forms, which are most often encountered in nature.
Note: There is confusion in the informal nomenclatures for branched fatty acids in scientific publications. For example, 13-methyl-tetradecanoate acid is sometimes abbreviated to iso-methyl-14:0 and sometimes iso‑methyl-15:0; I prefer the former as it better reflects the systematic name, although many microbiologists tend to favour the latter.
Iso- and anteiso-Methyl-Branched Fatty Acids
The two most common type of branched-chain fatty acids are those with methyl branches in the iso or anteiso positions, and representative mass spectra are shown below. Unfortunately, the former has the least distinctive spectra of all the isomers. Note that mass spectra of branched isomers often appear busier or noisier than those of the analogous straight-chain esters.
The mass spectrum of methyl iso-methylhexadecanoate (or 15-methylhexadecanoate) -
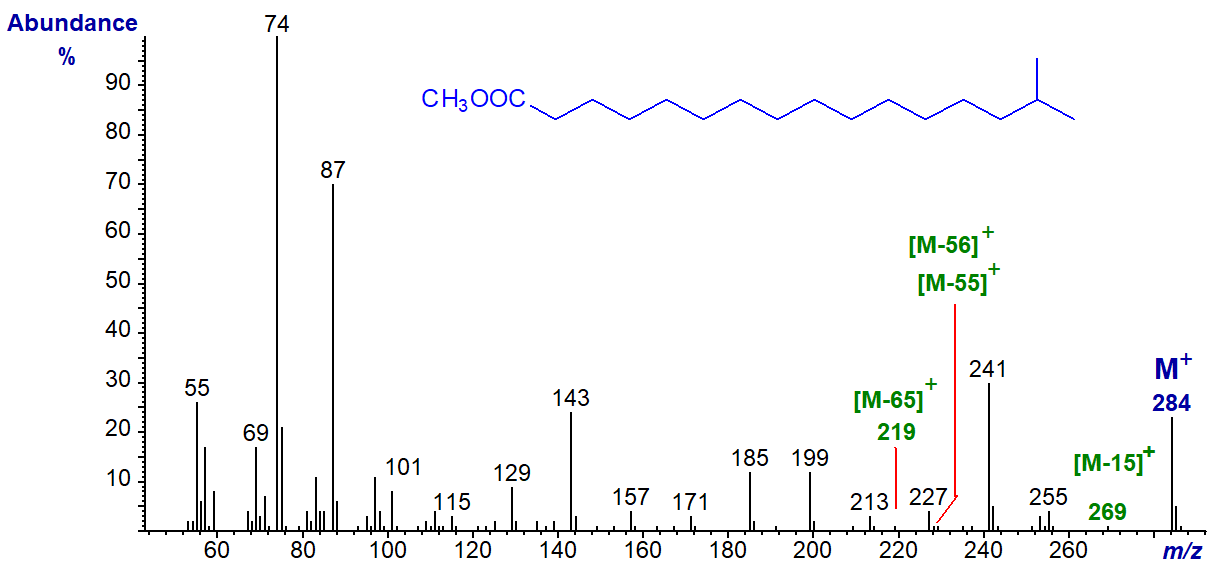
In this instance, the features that may distinguish the spectrum from that of the straight-chain analogue and other branched isomers are not always easy to see. Though small, the [M-15]+ ion (m/z = 269) may be larger in the spectrum of an iso-isomer than in that of the straight-chain analogue, and there is usually a doublet of ions for [M‑31/2]+ (see the papers cited above). The other ions of diagnostic value are rather small (<1% of the base ion), and equivalent to [M‑65]+, [M‑55]+ and [M‑56]+, here at m/z = 219, 229 and 228, respectively, but these may not apply uniformly across the chain-length range. As with normal saturated fatty acids, the McLafferty rearrangement ion at m/z = 74 is the base ion.
The mass spectrum of methyl anteiso-methyl-hexadecanoate (or 14-methyl-hexadecanoate) is illustrated next -
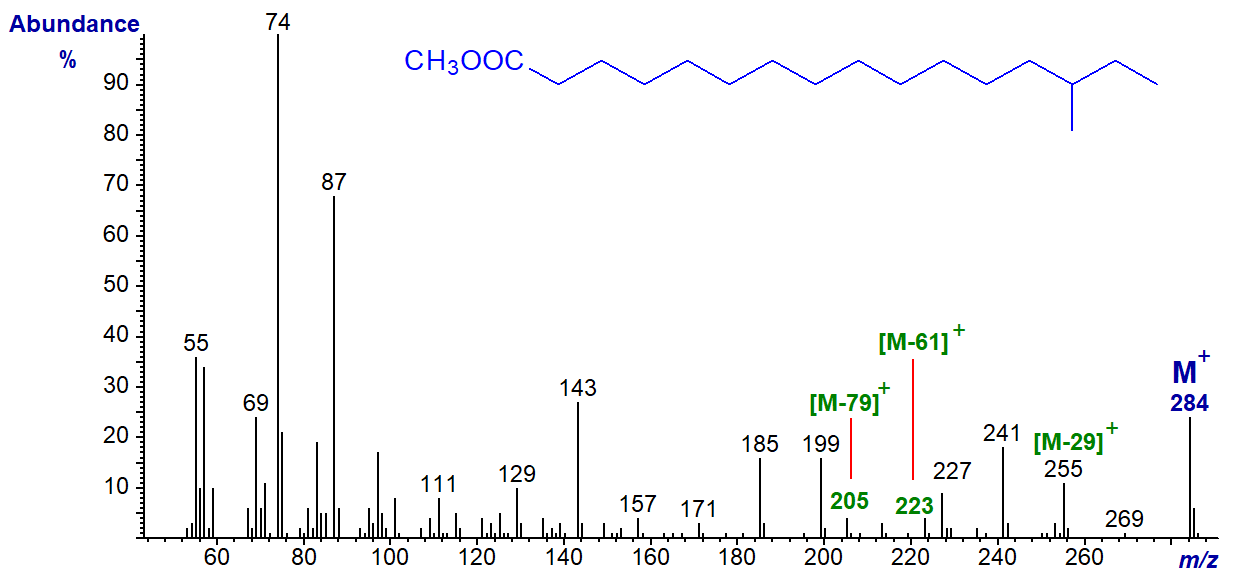
The molecular ion is clearly seen and the important distinguishing feature from the spectrum of the straight-chain analogue and that of the iso-isomer is that an ion at [M-29]+ (m/z = 255) is more abundant than that equivalent to [M‑31]+. Also, an ion at [M‑61]+ (m/z = 223) is small but distinctive (sometimes with ions at [M‑60]+ and [M‑79]+) (again see the papers cited above). We have found these ions in the spectra of the C14, C16 and C18 analogues, but they are less evident with the C20 and C24 analogues (number of carbons in the straight chain).
Certain other ions that are found in the spectra of all methyl-branched fatty acids are mentioned briefly in the next section. It can be helpful to be aware that it is more common to find iso-methyl fatty acids with an even number of carbons in total in natural samples, although the chain-length is odd-numbered, while the opposite is true for anteiso-isomers. It is useful to know that these two isomers elute after the corresponding fatty acids with the same number of carbons in the linear chain (one fewer in total) from all GC phases, regardless of polarity, with the iso-isomer eluting before the anteiso-isomer. Thus, as an example, the order of elution is methyl pentadecanoate (15:0) < iso-methyl-pentadecanoate < anteiso-methyl-pentadecanoate < hexadecanoate (16:0). If in doubt, hydrogenation is a useful supplementary technique to remove unsaturated components that might co-elute and confuse identification.
Fatty Acids with Centrally Located Methyl-Branches
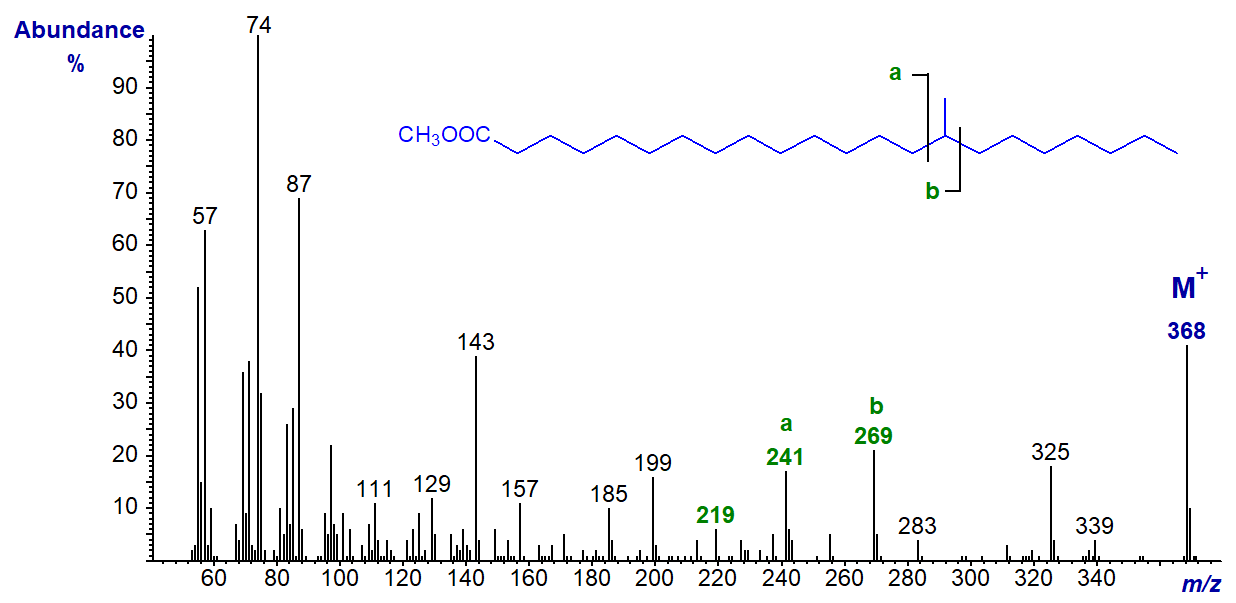
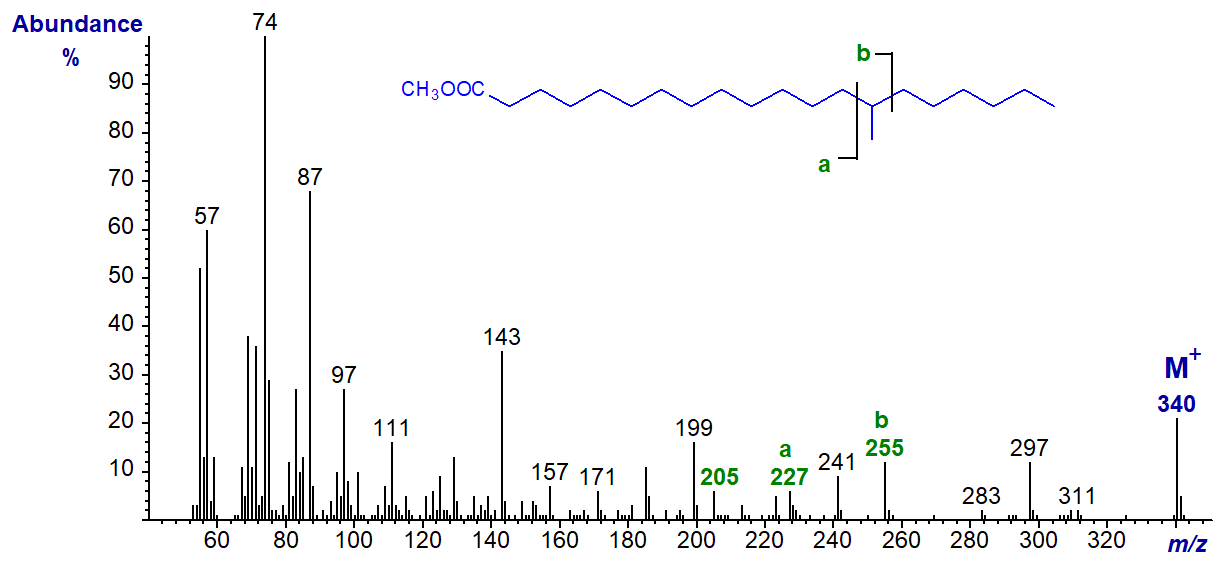
Fatty acids with methyl branches in more central positions are found in bacterial lipids, and they can be produced in some animal tissues, e.g., in ruminants or in human sebaceous secretions and vernix caseosa (the greasy secretion on the newborn baby), when methylmalonate is utilized instead of malonate in fatty acid biosynthesis. The methyl esters may then give spectra with distinctive fragments, ions 'a' and 'b' (together with 'a+1' and 'a+2'), on either side of the branch as shown -
 |
| Figure 3. Fragmentation of a methyl-branched ester. |
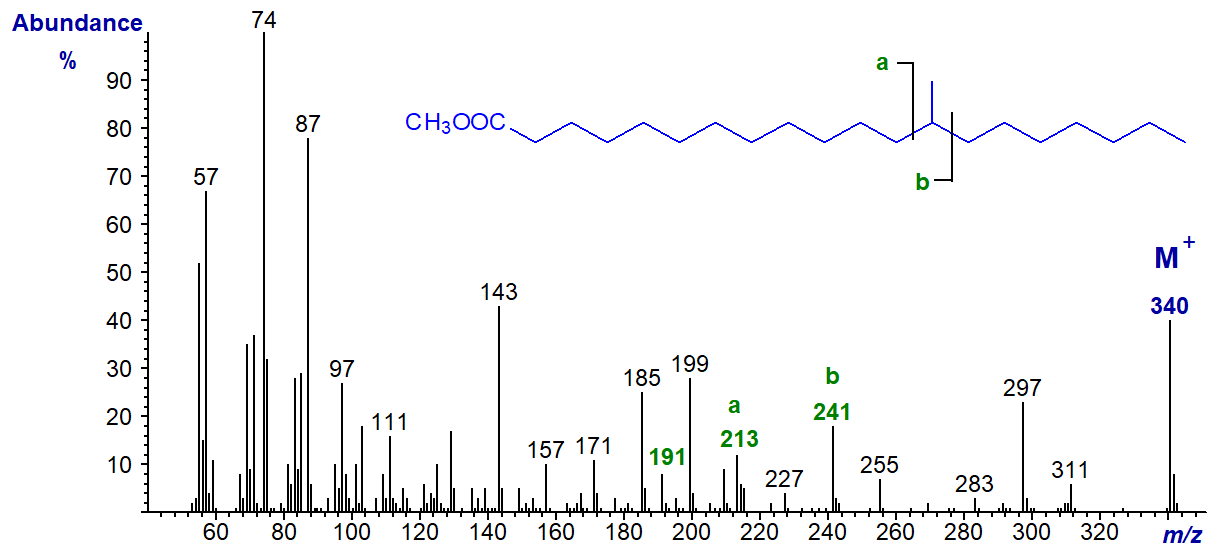
In addition, there may be diagnostic ions for 'b' after the loss of methanol, or strictly speaking a methoxyl group plus a hydrogen atom ([b‑32]+), and then for a further loss of a the elements of water ([b‑50]+). These ions are present in the two spectra above but are very small. In the spectrum of the anteiso-isomer, the 'a' ion is barely detectable, but the 'b' ion at m/z = 255, and those for 'b‑32' and 'b‑50' at m/z = 223 and 205, respectively, are clearly seen. Analogous ions are less easily distinguished in the spectrum of the iso-isomer.
As mentioned earlier, the spectra illustrated below were selected from the limited range available to us, with many different chain lengths, from our past research efforts. A high proportion of these were found in sponges, where they were probably derived from bacteria ingested as part of their diet.
Thus, in the mass spectrum of methyl 15-methyl-docosanoate, ion 'a' is at m/z = 241 and ion 'b' at m/z = 269 (b‑50, m/z = 219).
In the mass spectrum of methyl 14-methyl-eicosanoate, ion 'a' is at m/z = 227 and ion 'b' at m/z = 255 (b‑50, m/z = 205).
In the spectrum of methyl 13-methyl-eicosanoate, ion 'a' is at m/z = 213 and ion 'b' at m/z = 241 (b‑50, m/z = 191).
In the spectrum of methyl 11-methyl-octadecanoate, ion 'a' is at m/z = 185 and ion 'b' at m/z = 213.
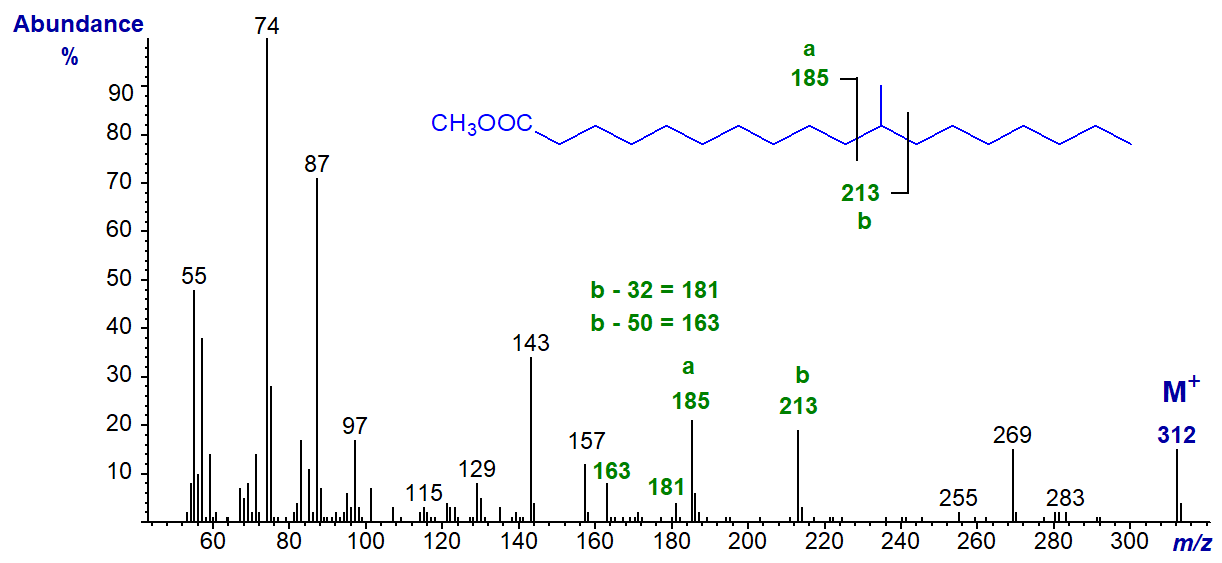
This spectrum has been selected to demonstrate the presence of both of the [b‑32]+ and [b‑50]+ ions, which are at m/z = 181 and 163, respectively, simply because they appear in a relatively noise-free part of the spectrum in this instance. I will leave readers to find the first of these ions in most of the other spectra.
In the spectrum of methyl 10-methyl-octadecanoate, ion 'a' is at m/z = 171 and ion 'b' at m/z = 199 (b-50 is at m/z = 149) -
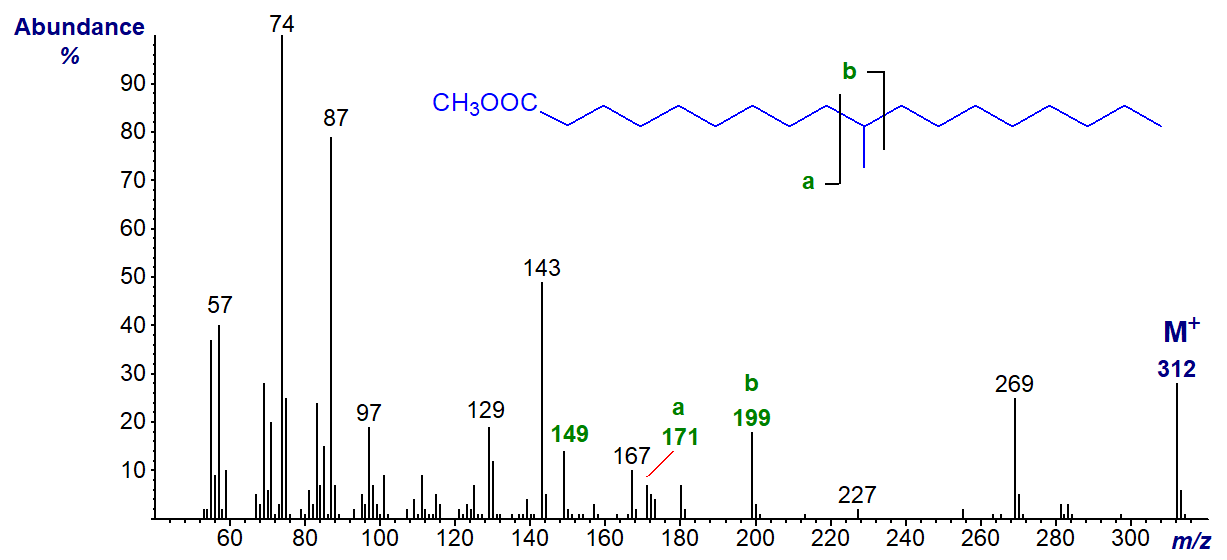
This fatty acid has the trivial name 'tuberculostearic acid' as it was first detected in the pathogen Mycobacterium tuberculosis. In this instance, the spectrum was obtained from the lipids of the bacterium Rhodococcus ruber courtesy of Gary Dobson. The spectrum of methyl 10-methyl-hexadecanoate has the same key diagnostic ions.
In the spectrum of methyl 9-methyl-tetradecanoate, ion 'a' is at m/z = 157 and ion 'b' at m/z = 185. The b‑32 and b‑50 ions are clearly seen.
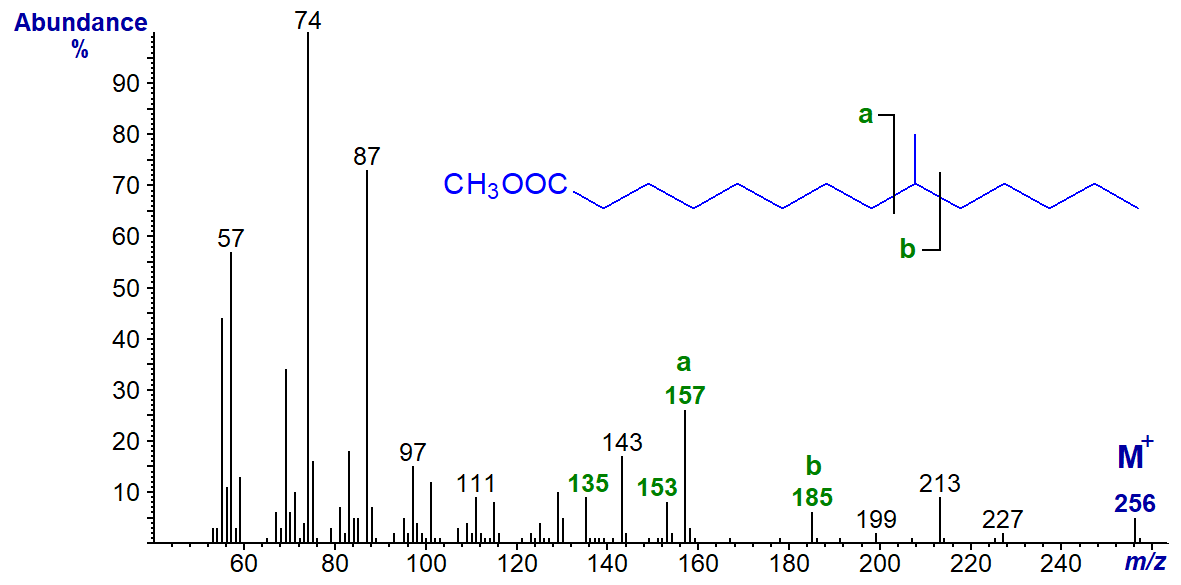
By extrapolation, for an 8-methyl-branch, we would expect the 'a' and 'b' ions to be at m/z = 143 and 171, respectively, and we can predict the diagnostic ions for other isomers in the same way, although we do not have relevant spectra to illustrate this. It is important to note that it might occasionally be difficult to identify an unknown unequivocally from such data without access to spectra of model compounds.
The spectrum of methyl 3-methylpentadecanoate is rather different. Ion 'b' at m/z = 101 (replacing that normally found at m/z = 87) is especially distinctive, together with 'b‑32' at m/z = 69, while ion 'a' is the McLafferty ion at m/z = 74. In the spectrum of a 2‑methyl equivalent, the McLafferty ion is at m/z = 88 (see the spectrum of methyl pristanate in the next section).

In most of the spectra above, ions equivalent to [M-43]+ and [M-29]+, which are presumed to be due to the loss of fragments consisting of carbons 2 to 4 and 2 to 3, respectively, are prominent. In the spectrum of the 3-isomer, these characteristic ions are shifted to at [M‑57]+ and [M‑43]+, presumably because these fragments now incorporate the methyl branch (see the web pages on methyl esters of normal saturated fatty acids for a discussion of the mechanism).
Multi-Methyl Branched Fatty Acids
In the mass spectra of methyl esters of multi-methyl-branched fatty acids, ions reflecting the first branch point are by far the most abundant. I have encountered one non-isoprenoid dimethyl-branched fatty acid in a sponge, i.e., 8,10-dimethyl-hexadecanoic acid and its methyl ester has the spectrum -

The 'b' ion for the methyl branch on C10 at m/z = 213, together with the ions representing [b‑32]+ and [b‑50]+ at m/z = 181 and 163, respectively, are clearly seen, but no 'a' ion is apparent. There is a complete complement of the expected ions for the first methyl group (on C8) as indicated on the spectrum, while the 'a*' ion at m/z = 143 is especially distinctive.
Isoprenoid fatty acids, derived from metabolism of the phytol component of chlorophyll, can occur in appreciable amounts in marine oils and in lipids of ruminant animals. Phytanic acid especially is known to accumulate in plasma of patients suffering from Refsum's syndrome in which there is a defect in one or other steps in the α-oxidation system. A few different isomers have been found in nature, and the mass spectra of the methyl esters of the three most common of these are illustrated below.
The mass spectrum of methyl 4,8,12-tridecanoate (from a fish oil) -

The McLafferty ion at m/z = 74 is no longer the base ion in the spectrum, because of the presence of the methyl branch on carbon 4; there is thus only one hydrogen atom available for abstraction. The 'a' ion for the first methyl group at m/z = 87 is now the most abundant ion. I will leave the reader to sort out most of the remaining 'a' and 'b' ions for this and the next two spectra - I am content to consider them as "fingerprints". A review by Lough (1975) discusses these spectra in some detail.
The mass spectrum of methyl pristanate or 2,6,10,14-tetramethylpentadecanoate is -

The mass spectrum of methyl phytanate or 3,7,11,15-tetramethylhexadecanoate is -

Note that the McLafferty ion at m/z = 88 is the base ion in the spectrum of methyl pristanate as it now contains the methyl group on carbon 2, while the ion at m/z = 101 for a fragment containing the methyl branch in position 3 dominates the spectrum of methyl phytanate.
Spectra of many more methyl esters of branched-chain fatty acids can be accessed from our Archive pages (without interpretation). Spectra of monoenoic fatty acids with methyl branches are discussed in the web page dealing with monoenes.
Note. Those with access to instruments with a facility for collisional dissociation of molecular ions generated by electron ionization (tandem mass spectrometry) will be able to obtain additional data that should remove any dubiety regarding interpretation (Ran‑Ressler et al., 2012).
References
- Apon, J.M.B. and Nicolaides, N. The determination of the position isomers of the methyl branched fatty acid methyl esters by capillary GC/MS. J. Chromatogr. Sci., 13, 467-473 (1975); DOI.
- Lough, A.K. The chemistry and biochemistry of phytanic, pristanic and related acids. Prog. Chem. Fats other Lipids., 14, 5-48 (1975); DOI.
- Ran-Ressler, R.R., Lawrence, P. and Brenna, J.T. Structural characterization of saturated branched chain fatty acid methyl esters by collisional dissociation of molecular ions generated by electron ionization. J. Lipid Res., 53, 195-203 (2012); DOI.
- Ryhage, R. and Stenhagen, E. Mass spectrometric studies. IV. Esters of monomethyl-substituted long chain carboxylic acids. Arkiv Kemi, 15, 291-315 (1959).
I recommend - Christie, W.W. and Han, X. Lipid Analysis - Isolation, Separation, Identification and Lipidomic Analysis (4th edition), 446 pages (Oily Press, Woodhead Publishing and now Elsevier) (2010) - from Science Direct.
| © Author: William W. Christie |  |
|
| Updated: May 2025 | Contact/credits/disclaimer | |
© The LipidWeb is open access and fair use is encouraged but not text and data mining, AI training, and similar technologies.
