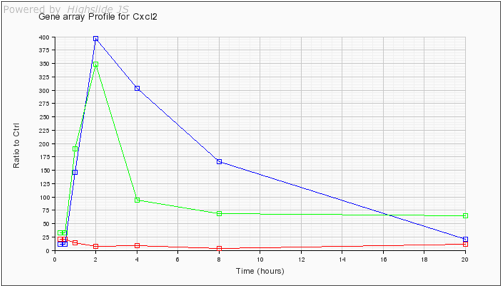
Lipidomics studies on macrophages
Details: 7Z,10Z,13Z,16Z-docosatetraenoic acid
|
 : View time course graphs
| Details | Graph
| LM_ID | Name | Kdo+ATP ATP Kdo Ctrl 0 hrs |
Kdo+ATP ATP Kdo Ctrl 15 min |
Kdo+ATP ATP Kdo Ctrl 30 min |
Kdo+ATP ATP Kdo Ctrl 1 hr |
Kdo+ATP ATP Kdo Ctrl 2 hrs |
Kdo+ATP ATP Kdo Ctrl 4 hrs |
Kdo+ATP ATP Kdo Ctrl 8 hrs |
Kdo+ATP ATP Kdo Ctrl 20 hrs |
Units . . . . | ||
|---|---|---|---|---|---|---|---|---|---|---|---|---|---|---|
 |
Legend:
Legend: (MSG090924) | LMFA01030178 | 7Z,10Z,13Z,16Z-docosatetraenoic acid | - - - 0.562 |
1.61 0.871 0.739 0.734 |
1.75 1.06 0.998 0.866 |
1.61 1.39 0.695 0.769 |
1.8 0.746 0.89 1.11 |
1.68 0.764 0.92 0.891 |
1.42 0.433 0.809 0.971 |
2.07 0.941 1.32 1.19 |
pmol/ug DNA | ||
|
Legend:
Legend: (MSG090928) | LMFA01030178 | 7Z,10Z,13Z,16Z-docosatetraenoic acid | - - - 0.23 |
0.391 0.341 0.189 0.16 |
0.46 0.281 0.198 0.244 |
0.35 0.299 0.179 0.187 |
0.269 0.311 0.199 0.335 |
0.286 0.23 0.258 0.236 |
0.314 0.219 0.286 0.383 |
0.361 0.318 0.245 0.262 |
pmol/ug DNA | ||
|
Legend:
Legend: (MSG090928) | LMFA01030178 | 7Z,10Z,13Z,16Z-docosatetraenoic acid | - - - 0.297 |
1.09 0.784 0.502 0.375 |
0.765 0.464 0.411 0.353 |
0.783 0.609 0.461 0.264 |
0.698 0.465 0.428 0.295 |
0.37 0.326 0.296 0.317 |
0.645 0.299 0.311 0.373 |
0.903 0.439 0.636 0.564 |
pmol/ug DNA |